
Article Metrics
0
CrossRef Citations
Media have made misinformation conversations part of daily life. We looked at nearly four decades’ worth of news stories about misinformation to see exactly what this coverage looked like. We searched five major U.S. daily newspapers for articles containing the misinformation-related terms—disinformation, misinformation, conspiracy theory, fake news, and propaganda—then extracted words in proximity to these key terms to identify associative patterns. Propaganda was the dominant term used by major newspapers prior to 2016, when term frequency and variety increased, peaking in 2020. Since 2016, newspaper usage of these terms has focused primarily on Donald Trump, Russia, social media, and U.S. elections.

Research Questions
- How has the frequency of misinformation coverage in U.S. newspapers changed over time?
- What topics or entities have been associated with misinformation coverage, and how have these changed over time?
- How are different misinformation-related terms being used?
Essay Summary
- We examine how frequently and in what context newspapers use misinformation-related terms.
- Our ProQuest query yielded 196,989 articles written between 1987 and 2024 containing 292,266 instances of misinformation-related terms.
- After we extracted the 50 words surrounding each instance of a term, we ranked and compared them to determine the most common words in proximity to the search term.
- Misinformation-related term use rose dramatically in late 2016; thus, much of our analysis focuses on 2016–2024.
- Propaganda and conspiracy theory were relatively consistently used from 1987 to 2015. They were then overshadowed by the explosive rise of misinformation and disinformation.
- Donald Trump, Russia, and U.S. elections were by far the top focus of misinformation-related coverage throughout the time series.
- Newspapers used misinformation-related terms in distinct yet overlapping contexts: disinformation with state actors, predominantly Russia; misinformation with reference to social media and COVID-19; conspiracy theory with Trump and various right-wing interests (QAnon, January 6th, etc.); fake news with Trump and the media in general; propaganda with U.S. adversaries (Russia, China, North Korea, Iran).
- This work shows the value of using large datasets that span decades, computational methods of analysis, and a range of misinformation-related terms.
Implications
Journalists and scholars share a sustained interest in the “misinformation beat” (McClure Haughey et al., 2020). To help bring misinformation research in line with current newspaper reporting, we designed a study that uses computational methods to analyze 38 years’ worth of stories in five of the six top-circulated U.S. newspapers, focusing on a set of five misinformation-related terms (disinformation, misinformation, conspiracy theory, fake news, and propaganda). Large-scale temporal analyses have proven useful for researchers interested in U.S. newspaper coverage (e.g., Kwak et al., 2020; Wardle & Derakhshan, 2017). Researchers have a well-established interest in the news media’s use of misinformation-related terms, too, focusing largely on the single term fake news (Egelhofer et al., 2020; Farhall et al., 2019; Farkas, 2023a; Farkas, 2023b; Riebling & von der Wense, 2019); less has been written about the specific uses of increasingly popular terms like misinformation and disinformation. Of the studies that do examine specific term use, Thorson (2024) includes content analysis of 800 newspaper articles on mis- and disinformation as part of research into news media effects on perceptions and trust. Farkas and Schousboe (2024) included a diversity of misinformation terms in their analysis of the Danish press, but their work was a self-assessment by journalists rather than an investigation of the text they produced. More expansive analyses that include more terms like propaganda and conspiracy theory have received fairly little treatment, despite both terms being highly salient concepts in the U.S. media ecosystem (Anderson, 2021).
Our quantitative, multi-term, longitudinal study helps fill an important research gap. We show that, over time, newspapers reflect and reinforce associations between specific misinformation-related terms and an assortment of people, places, and social media platforms. The result is an emergent pattern of distinct yet overlapping contexts in how newspaper reporters have used each of these misinformation-related terms.
While single-term research is valuable, future research that includes multiple misinformation-related terms is also important for capturing the breadth of public discussion. In addition, using natural language processing methods like sentiment analysis, named entity recognition, and grammatical analysis on this dataset would allow for a deeper study of specific aspects of misinformation discourse in U.S. newspapers. Our method of concordance analysis could also be usefully applied to corpora beyond newspapers and the context of the U.S. news media.
Findings
Finding 1: Misinformation-related term usage began sharply increasing in 2016, peaking in 2020.
Figures 1 and 2 are, respectively, a 100% stacked area chart and a compound line graph of our full dataset (1987–2024), allowing us to see both the relative percentage and total number of occurrences for all of our search terms in a given month. In Figure 1, each color corresponds to a given term and the extent of that color along the vertical axis indicates the percentage of that term’s usage in that month as a proportion of all five misinformation terms we examined. In Figure 2, the height of each spike corresponds to the number of times that any of these terms are used in a given month. To ensure the accuracy of our interpretation of the raw counts, we also investigated these terms as a proportion of the total words per month in our dataset, contained in our Appendix. Figure A2 shows the same content as Figure 2, but with a normalized line representing all of our terms as a proportion of the total word count per month.
From 1987 until about 2016, the misinformation beat was largely one of reporting on propaganda, as seen by the orange portion of both graphs; it remained relatively consistent during that time. In contrast, fake news (dark blue) appeared in force in October 2016 and decreased after 2019. The term “misinformation” (light blue) had been used in small amounts prior to 2016 and saw a large and sustained increase afterwards. All terms saw a major spike in usage in 2020. Misinformation-related coverage for the entire 38-year period peaked at 4,753 instances in October 2020.
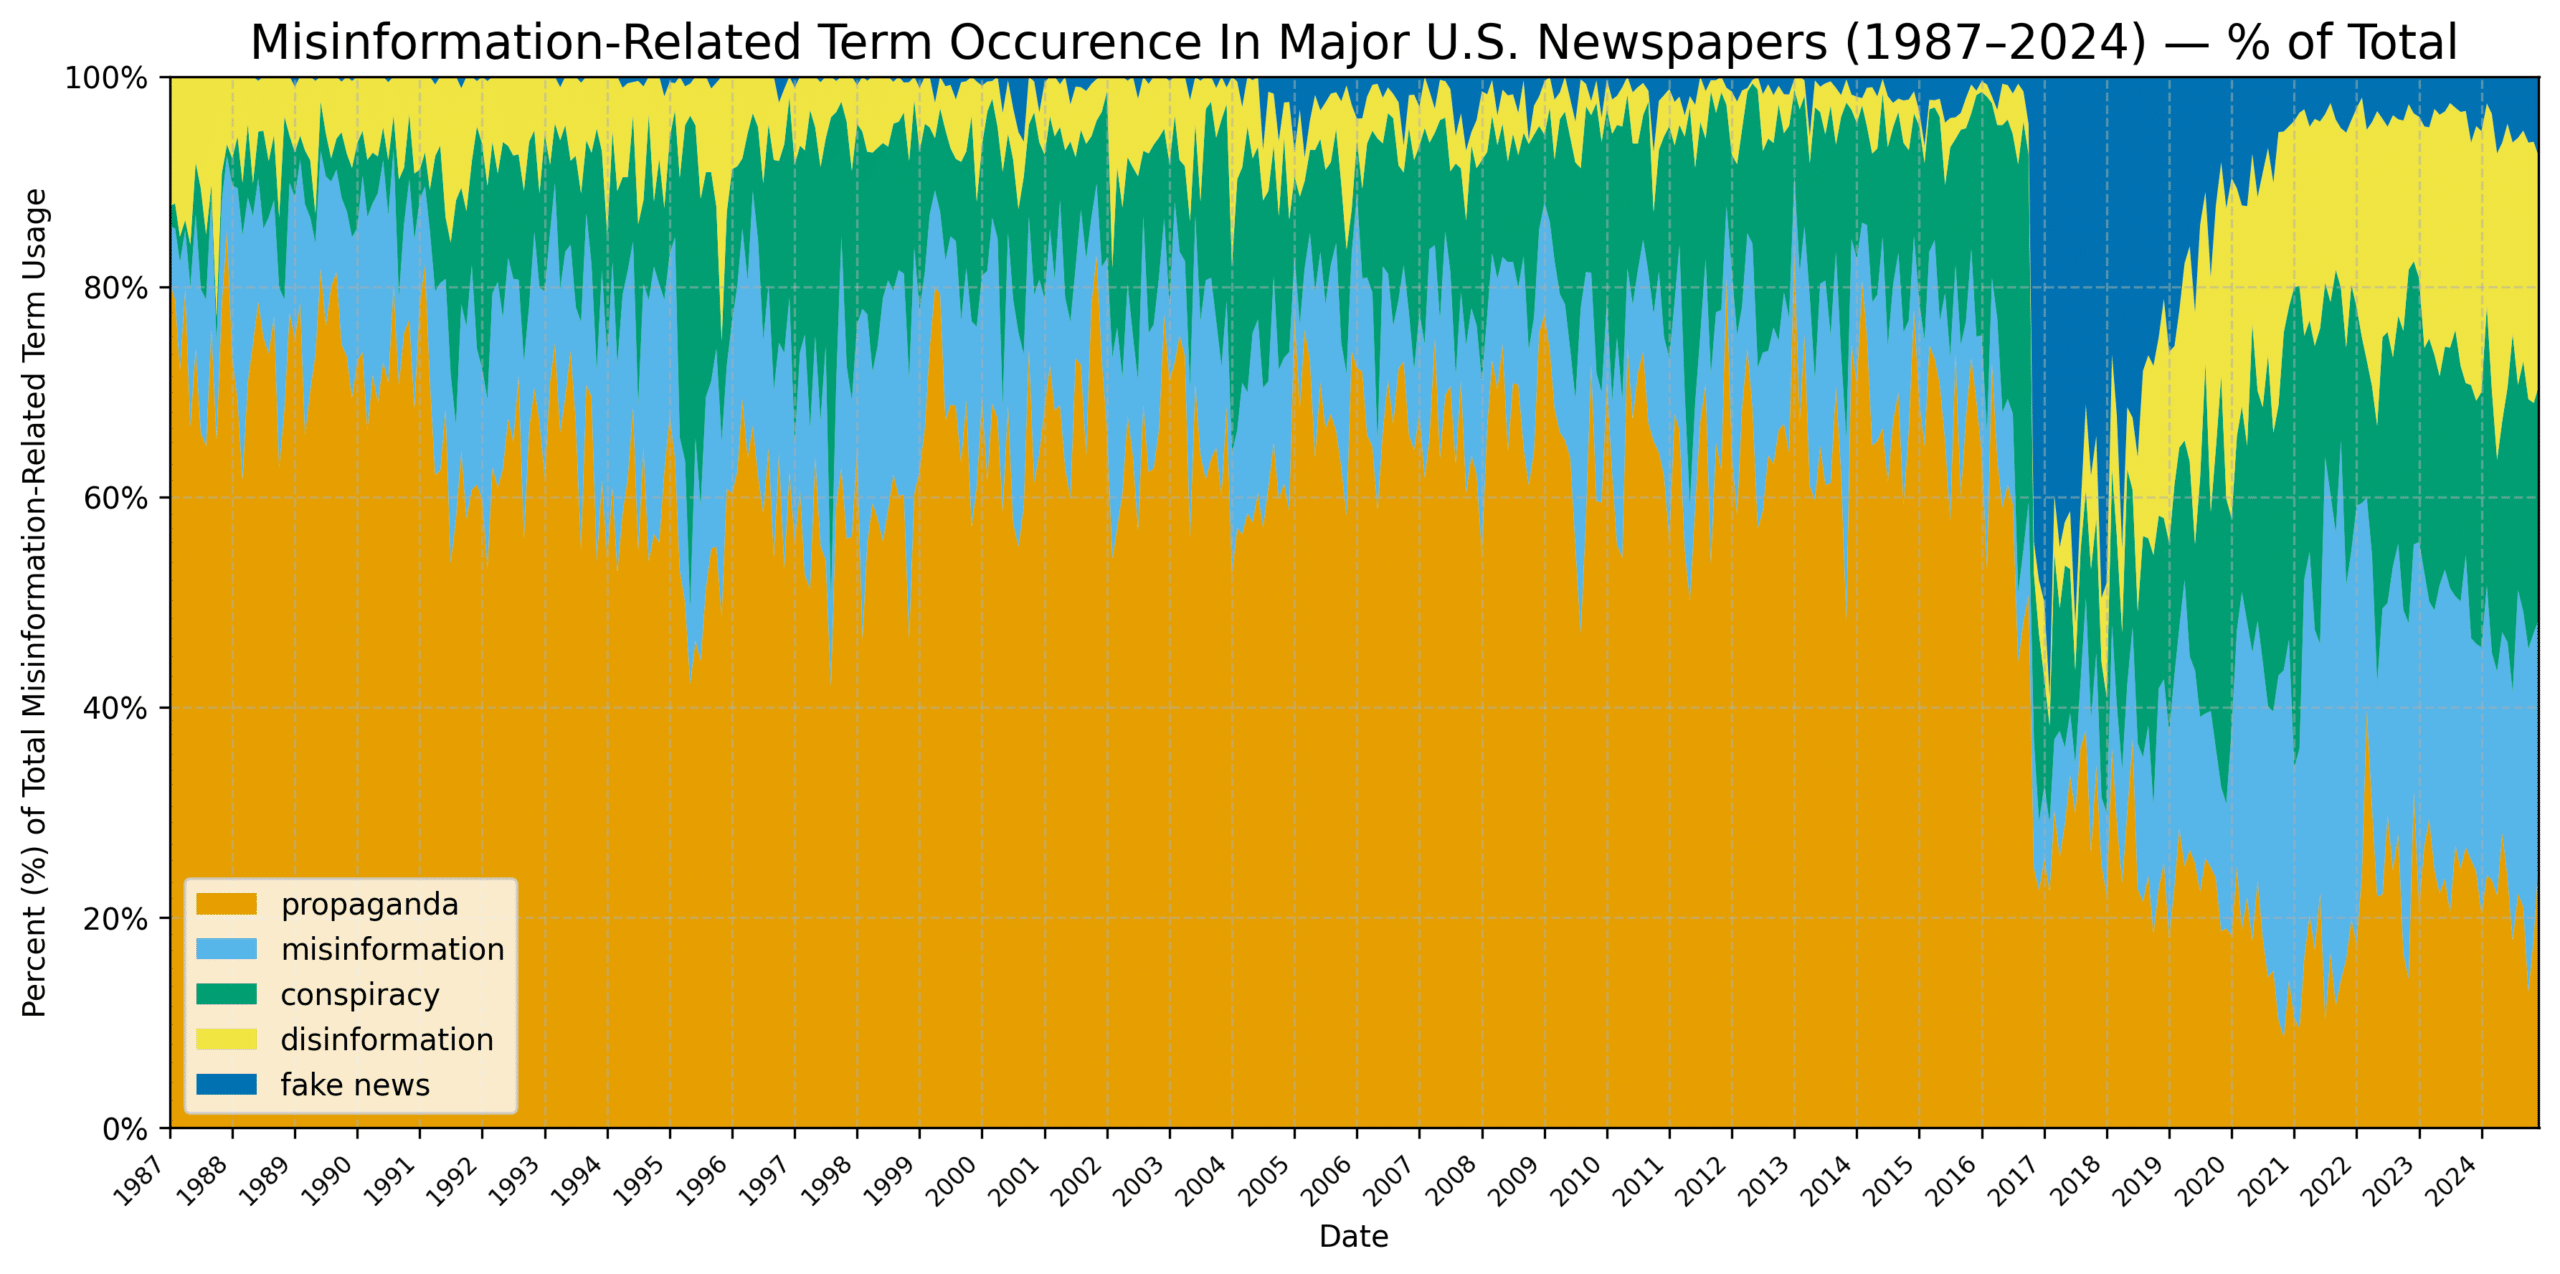
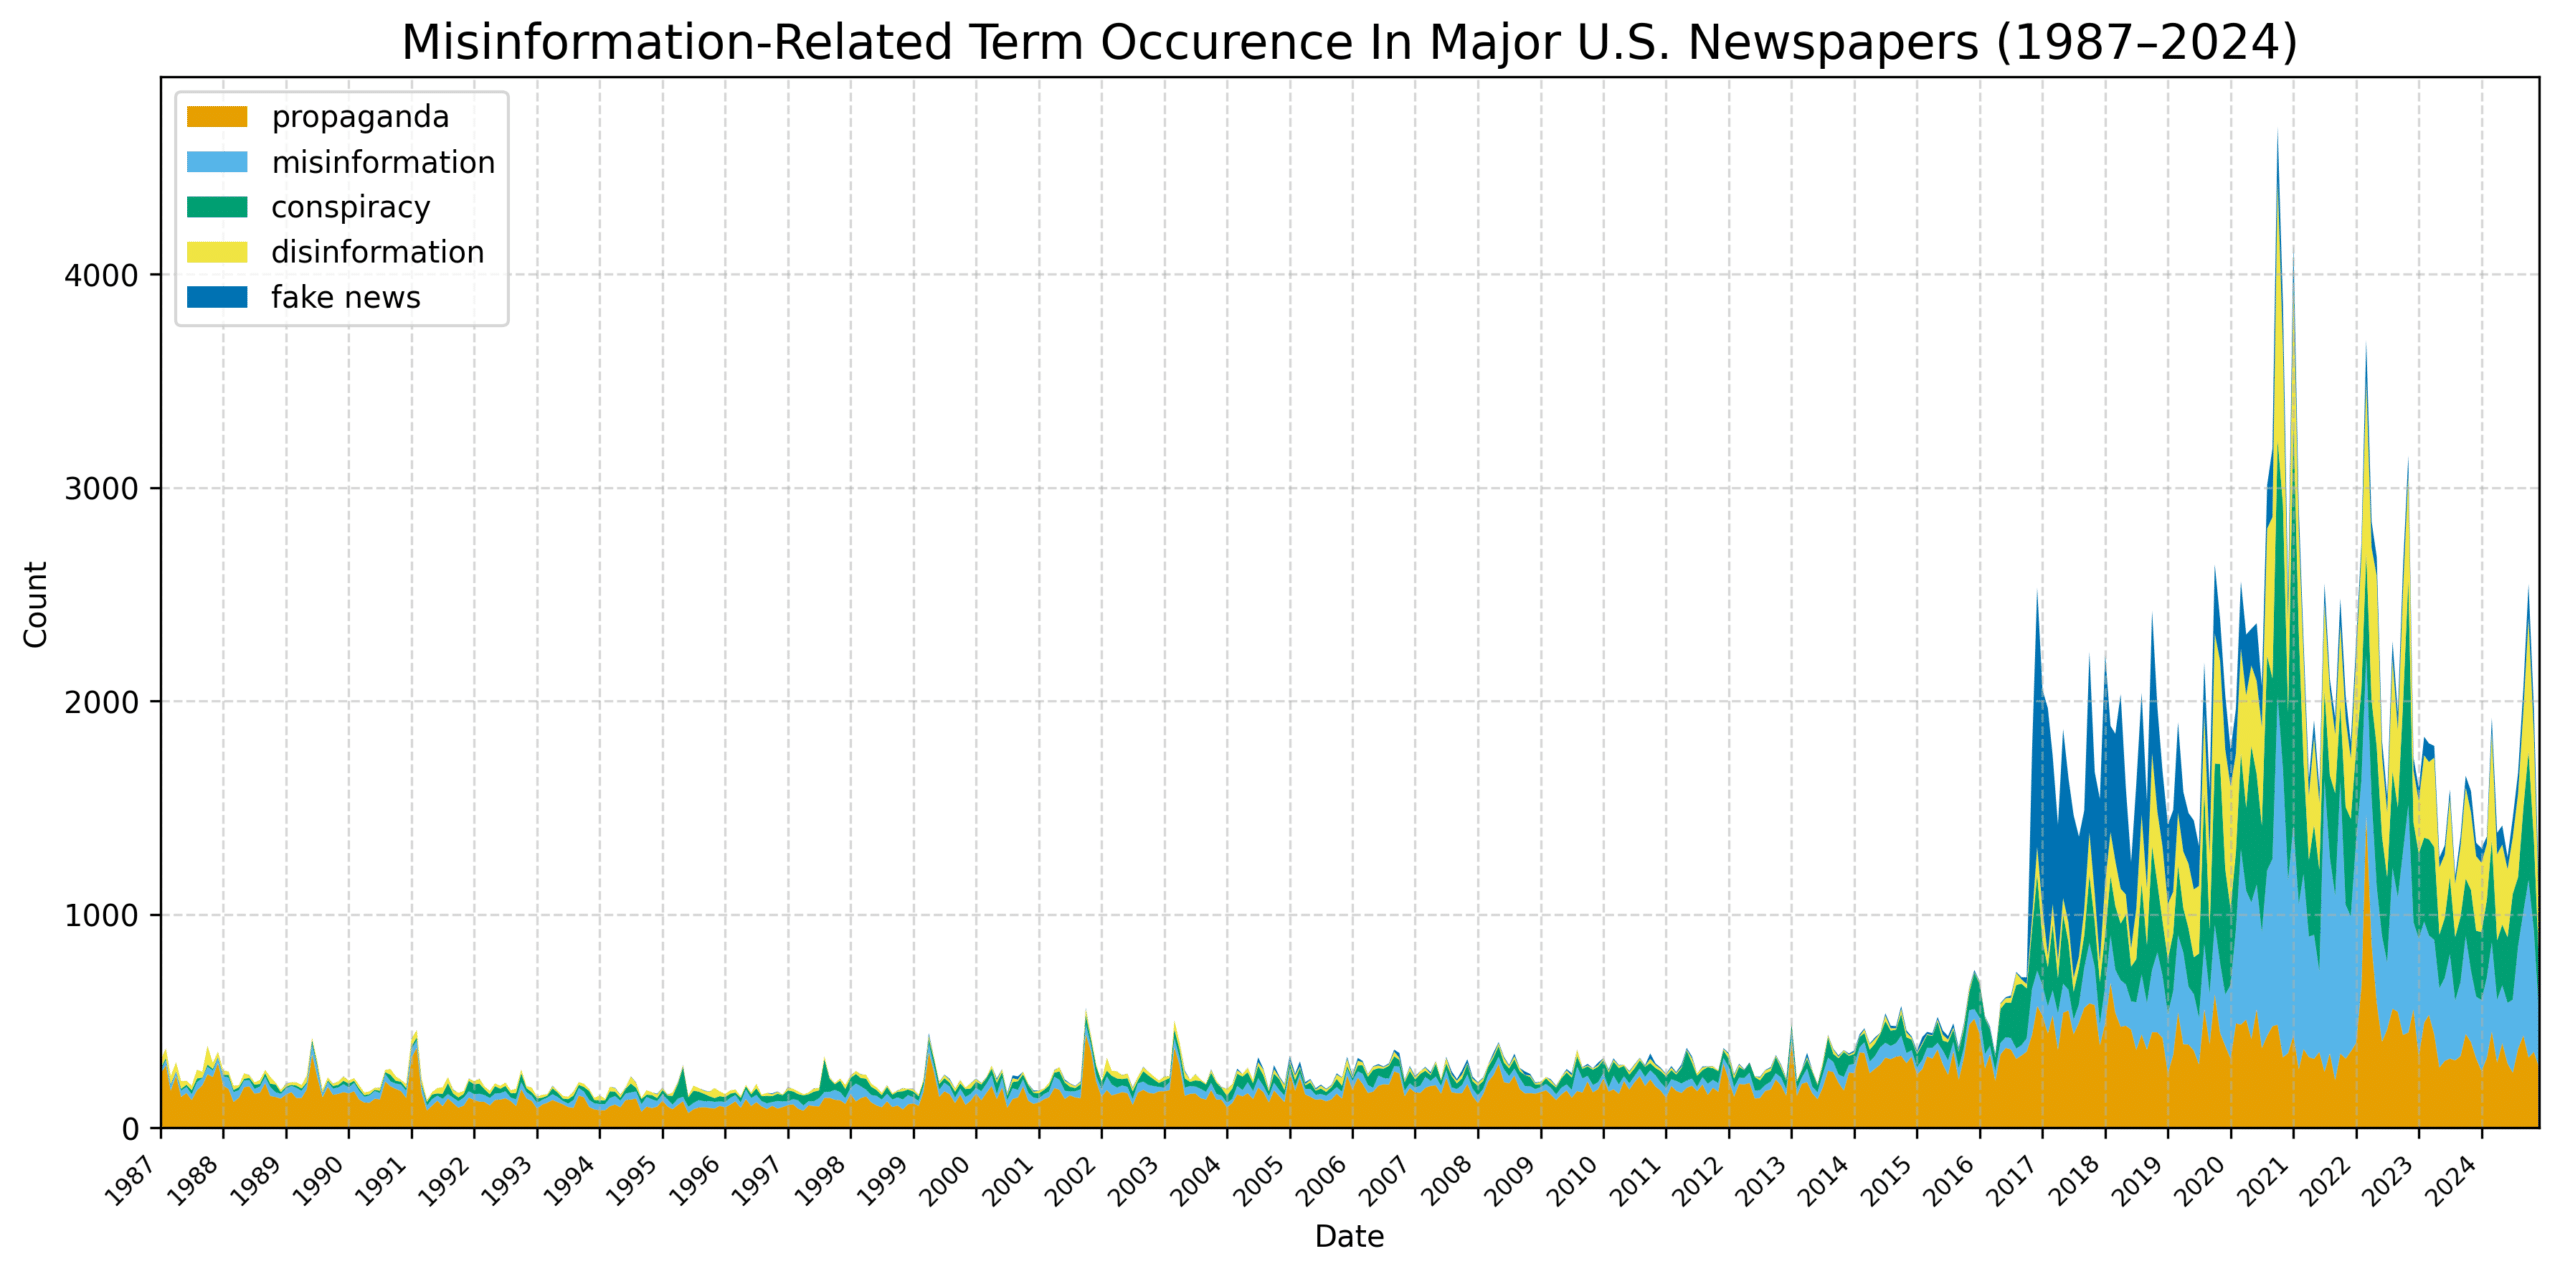
Table 1 provides statistical summaries of our raw term frequencies separated into the periods of 1987–2015 and 2016–2024. From this, we can see that the term propaganda was considerably more common in the 1987–2015 period relative to the other terms with a mean of 170.64, more than all the other terms’ means combined, a finding also seen in Figure 1. In contrast, the 2016–2024 period sees more balance between the term frequencies. This provides additional support to our decision to focus on the 2016–2024 period, as this period sees more interesting and dramatic differences in the relative use of these terms compared to the previous period.
| 1987–2015 | 2016–2024 | |||||
| Term | Mean | Max | SD | Mean | Max | SD |
| Propaganda | 173.11 | 512 | 70.76 | 428.18 | 1471 | 147.18 |
| Misinformation | 34.62 | 114 | 12.28 | 4267.56 | 1535 | 313.50 |
| Disinformation | 14.23 | 88 | 9.36 | 329.66 | 1219 | 209.65 |
| Conspiracy theory | 36.18 | 170 | 23.34 | 426.56 | 1535 | 313.50 |
| Fake news | 3.20 | 28 | 5.00 | 261.98 | 1214 | 281.24 |
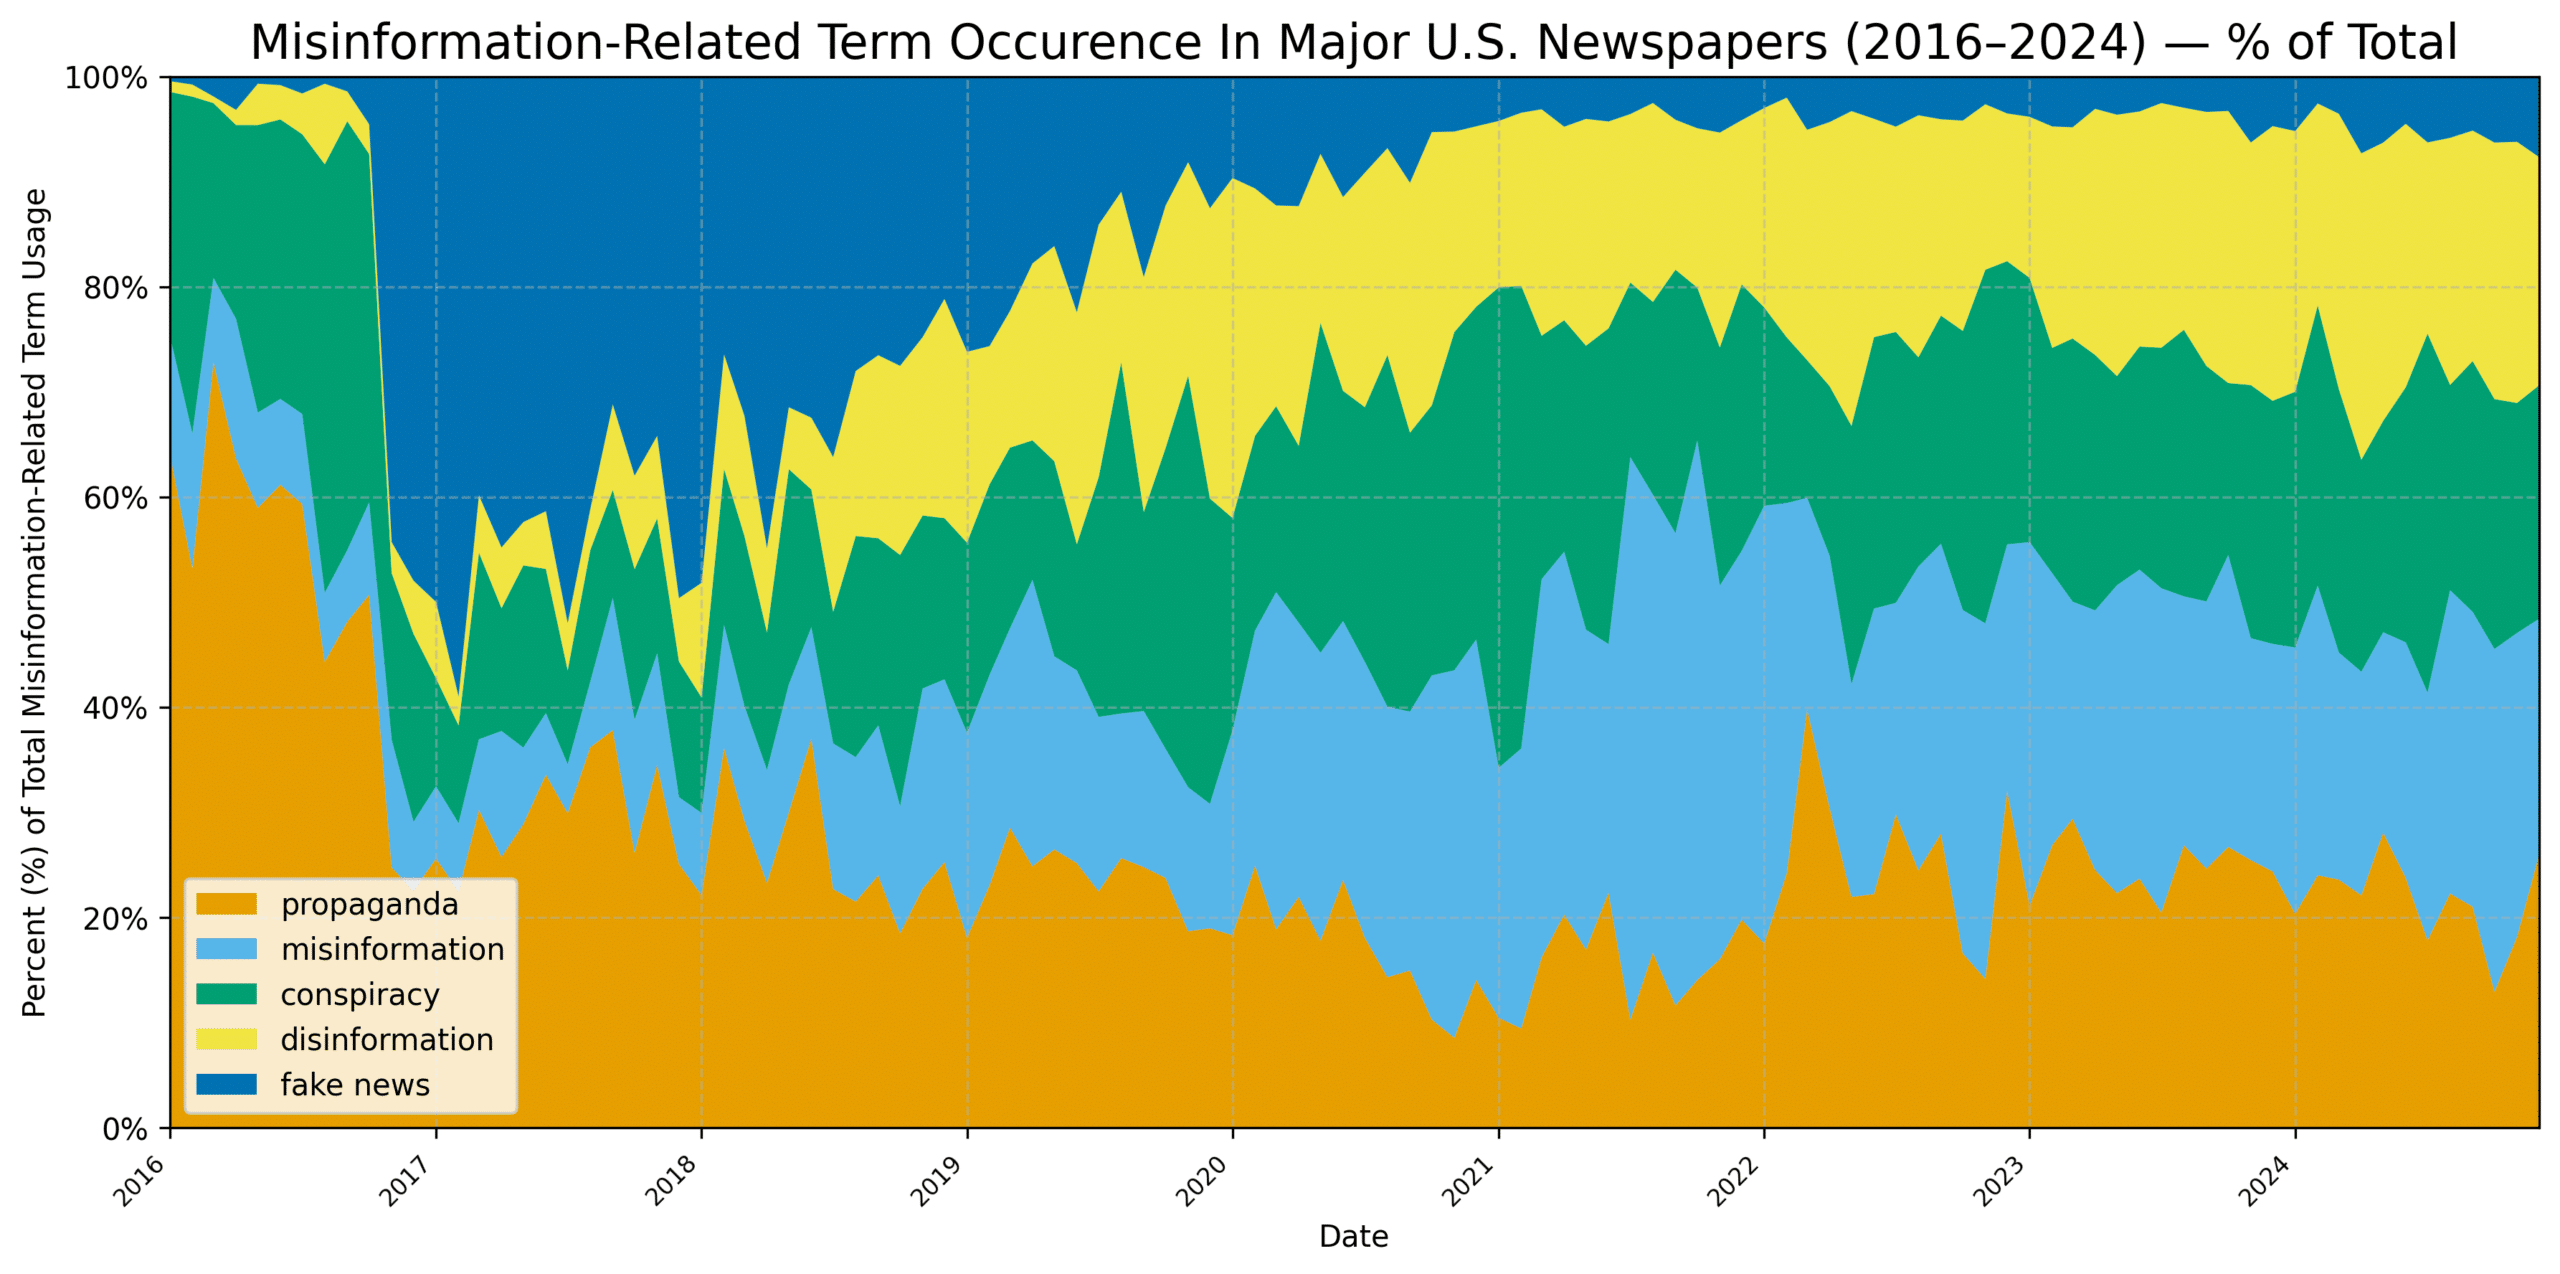
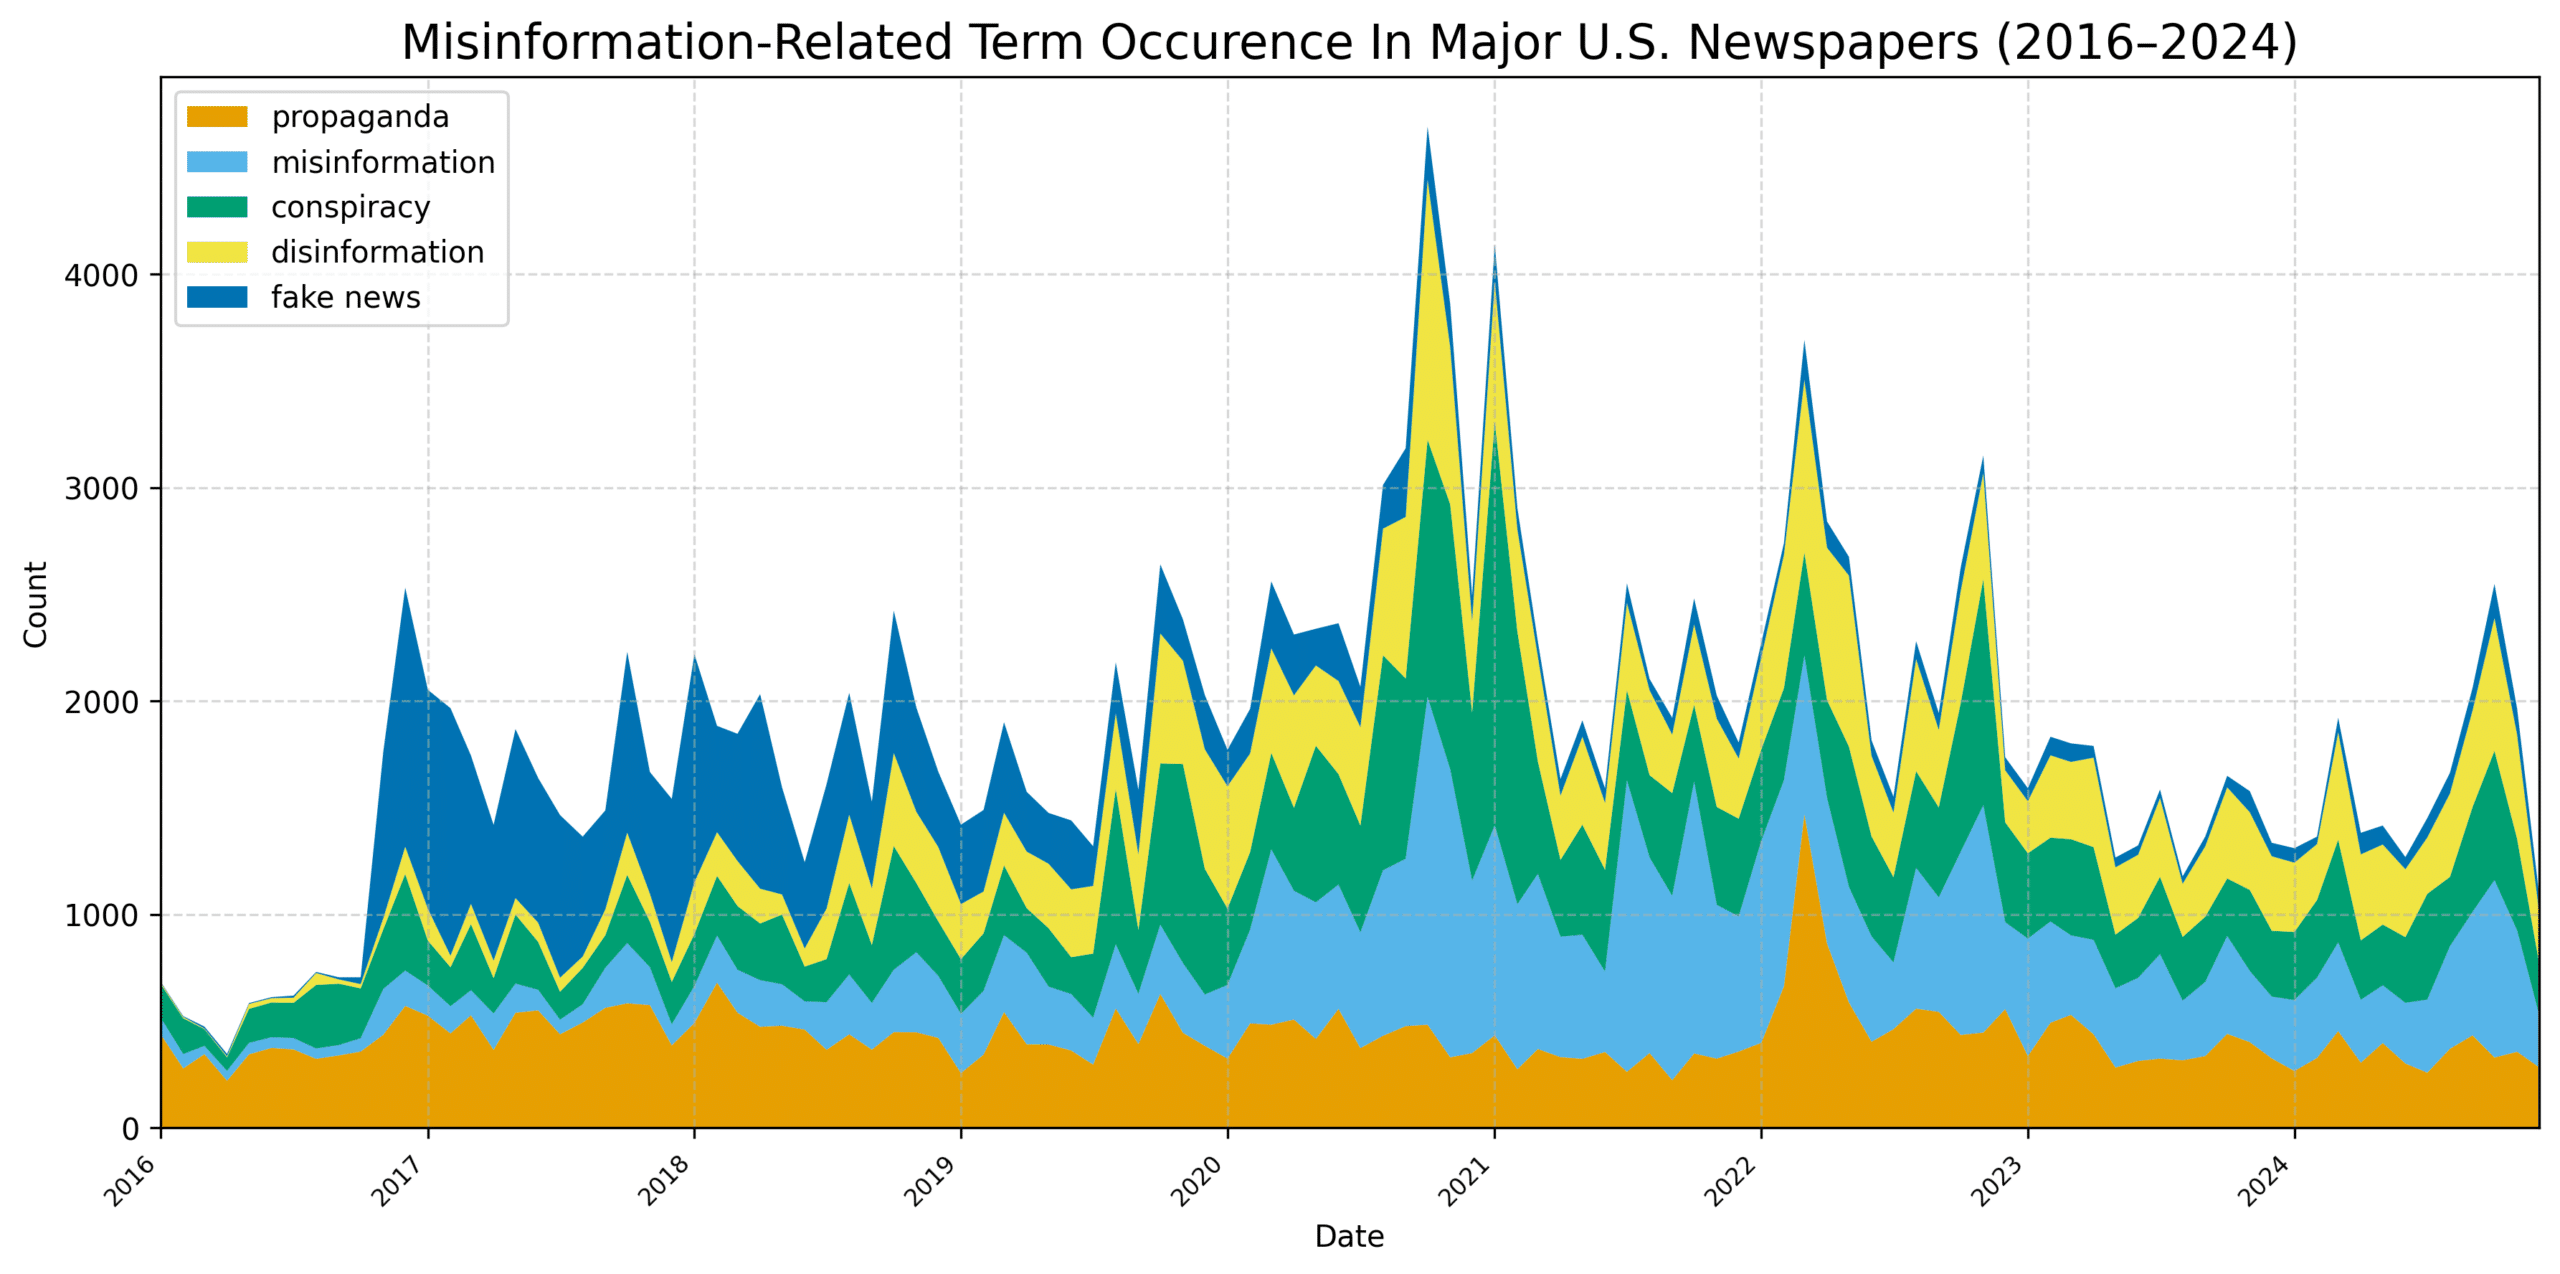
In Figures 3 and 4, we focus on the period from 2016 to 2024 (i.e., the right side of the graph in Figures 1 and 2). In Figure 3, we see a greater diversity of terms compared to Figure 1, with fake news appearing in late 2016 and maintaining prominence until fading in relative use by 2020. The period 2019 onward sees the growing diversity and equity in misinformation term usage, as seen in Table 1. Figure 4 shows that all our searched terms showed a sizable increase in frequency during late 2016 and early 2017, corresponding with the first election of Donald Trump as U.S. President. Several notable spikes follow the peak coverage for all terms in October 2020: the COVID-19 pandemic (beginning March 2020) and vaccine rollout (Summer 2021), the 2020 U.S. presidential election, the Russian invasion of Ukraine (February 2022), the U.S. midterm elections that same year (October), and the 2024 U.S. presidential election, with peak coverage in October.
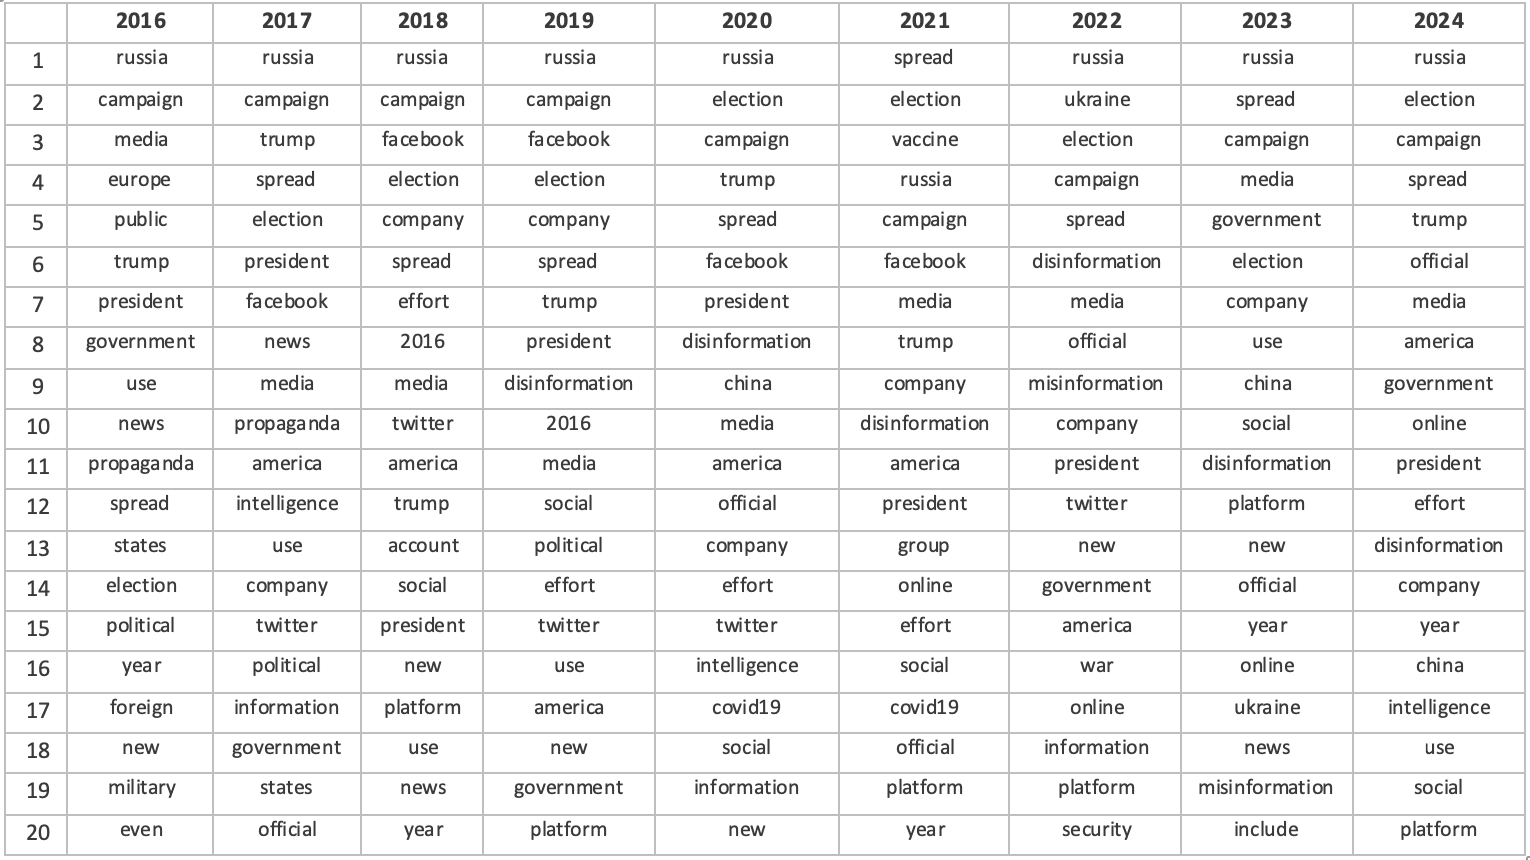
Finding 2: Trump, Russia, and U.S. elections were the top subjects of misinformation coverage since 2016.
Researchers rapidly identified 2016 as a key inflection point in the emergence and academic coverage of what was then referred to as fake news (Allcott & Gentzkow, 2017; Del Vicario et al., 2016; Lazer et al., 2018); our findings confirm this timing. Given this markedly increased volume of reporting on our search terms in 2016, we chose to focus on the period from 2016 to 2024 (the last full year for which we have data) for much of our remaining analysis. During this time, Trump, Russia, election, and campaign were among the most frequent terms to co-occur with (i.e., appear within 25 words of) our misinformation-related terms (see Table 2). The relatively high occurrence of these four terms in proximity to our misinformation-related terms was driven in large part by reporting on alleged Russian interference in the 2016 election, further allegations and investigations that Trump colluded with Russia in the election interference, and Russia’s invasion of Ukraine in 2022. Facebook was also among the most frequent terms, as the conversation about misinformation also focused on the public effects of consuming misinformation on social media. Thus, during the last ten years, the “misinformation beat” appears to have been focused largely on Trump, Russia, and U.S. presidential elections, including the role of social media in spreading misinformation.
| Rank | Word | # Of Occurrences |
| 1 | Trump | 46,366 |
| 2 | Russia | 37,133 |
| 3 | election | 30,357 |
| 4 | media | 27,759 |
| 5 | spread | 27,043 |
| 6 | president | 26,853 |
| 7 | news | 23,996 |
| 8 | 22,808 | |
| 9 | campaign | 21,012 |
| 10 | America | 19,338 |
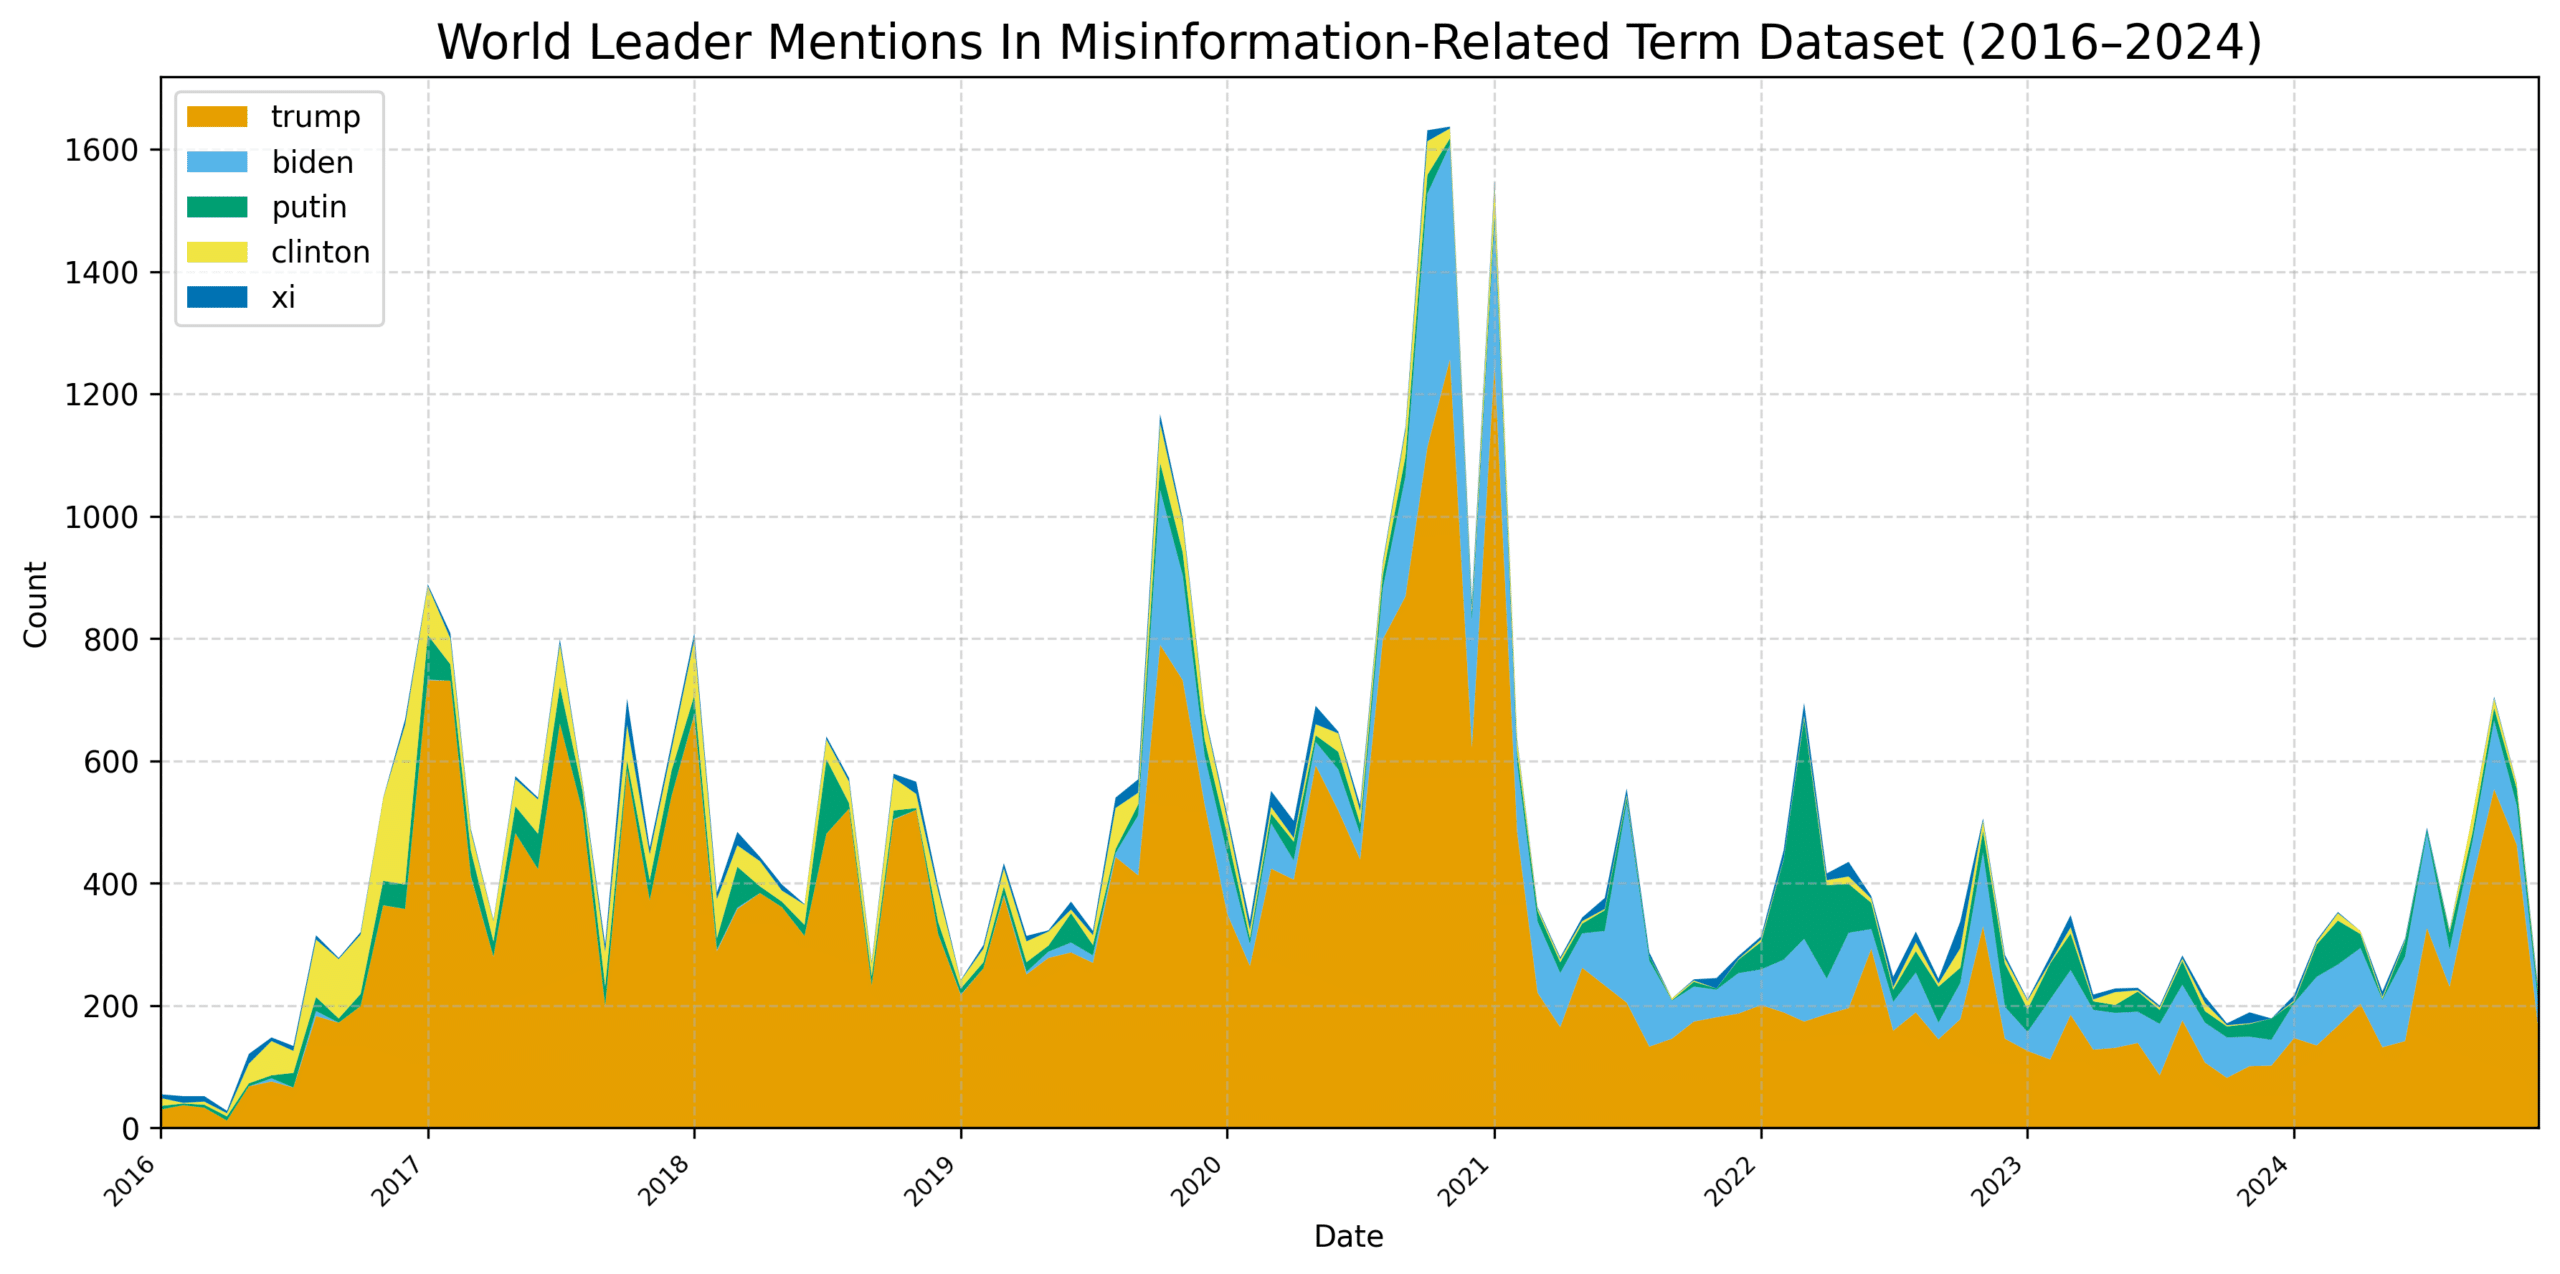
Finding 3: Trump overwhelms other U.S. and world leaders.
Figure 5 shows that Trump was associated with misinformation concepts to a greater degree and more consistently than any other domestic leaders and their families (Biden, Obama, Clinton) or international rivals. Notable surges include that of U.S. President Joe Biden in 2019 and Russian President Vladimir Putin in 2022. Chinese President Xi Jinping and Israeli Prime Minister Benjamin Netanyahu hardly registered.
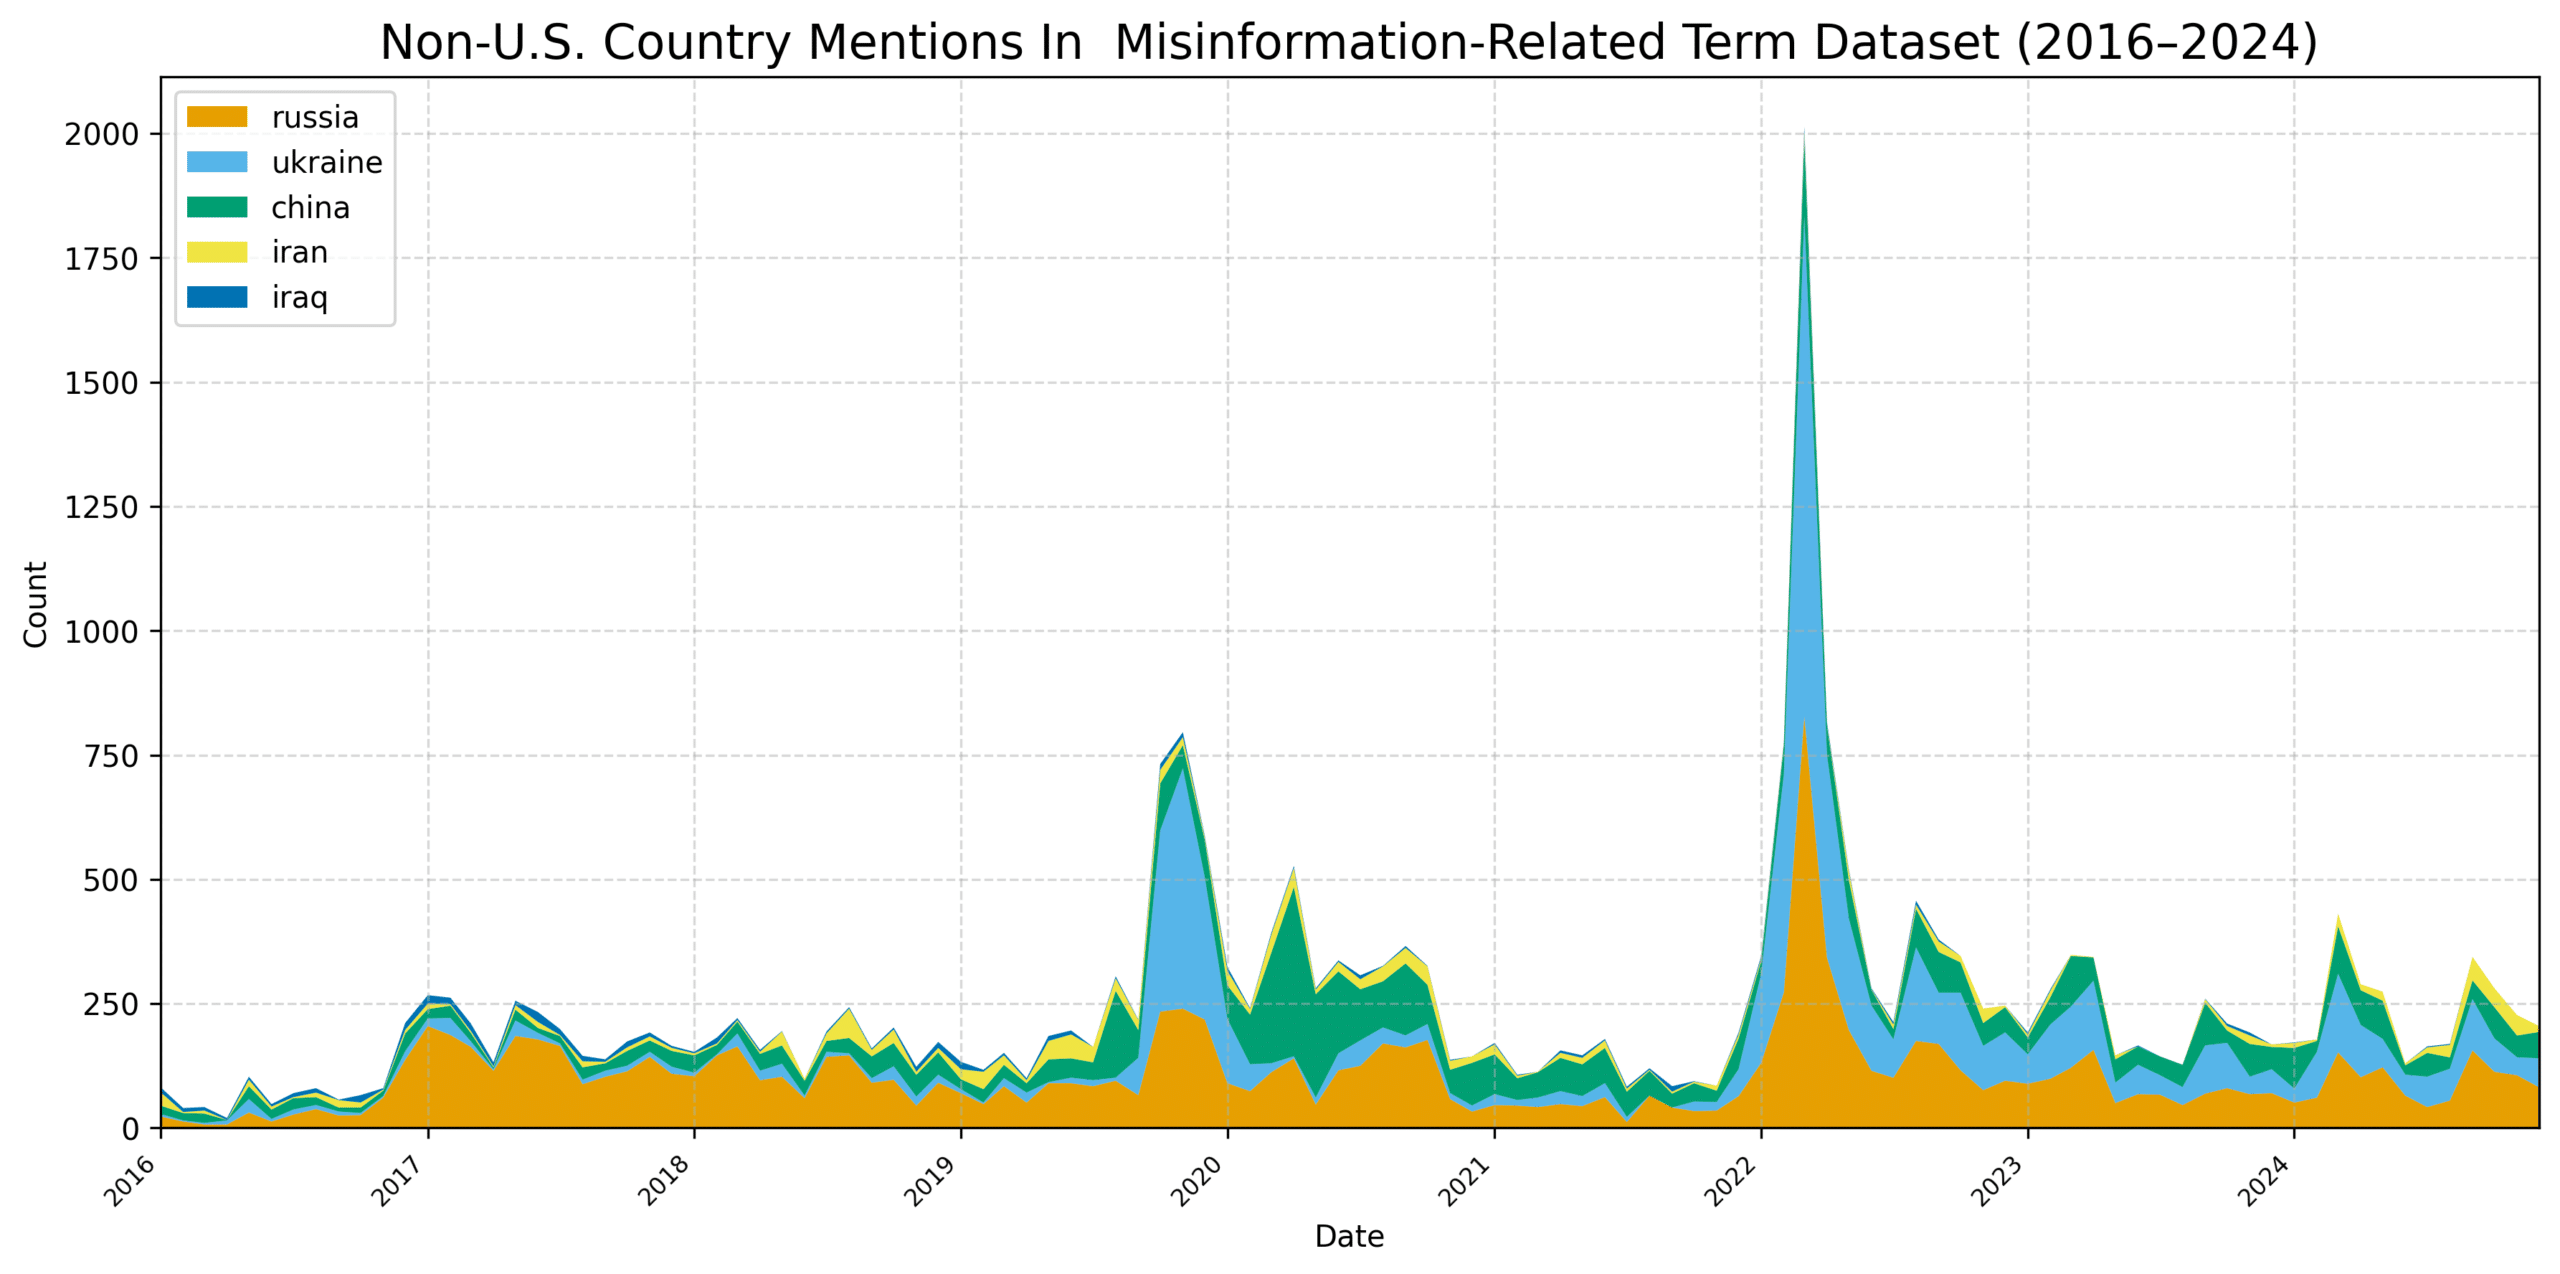
Finding 4: Russia is the consistent frontrunner, followed by China and Ukraine.
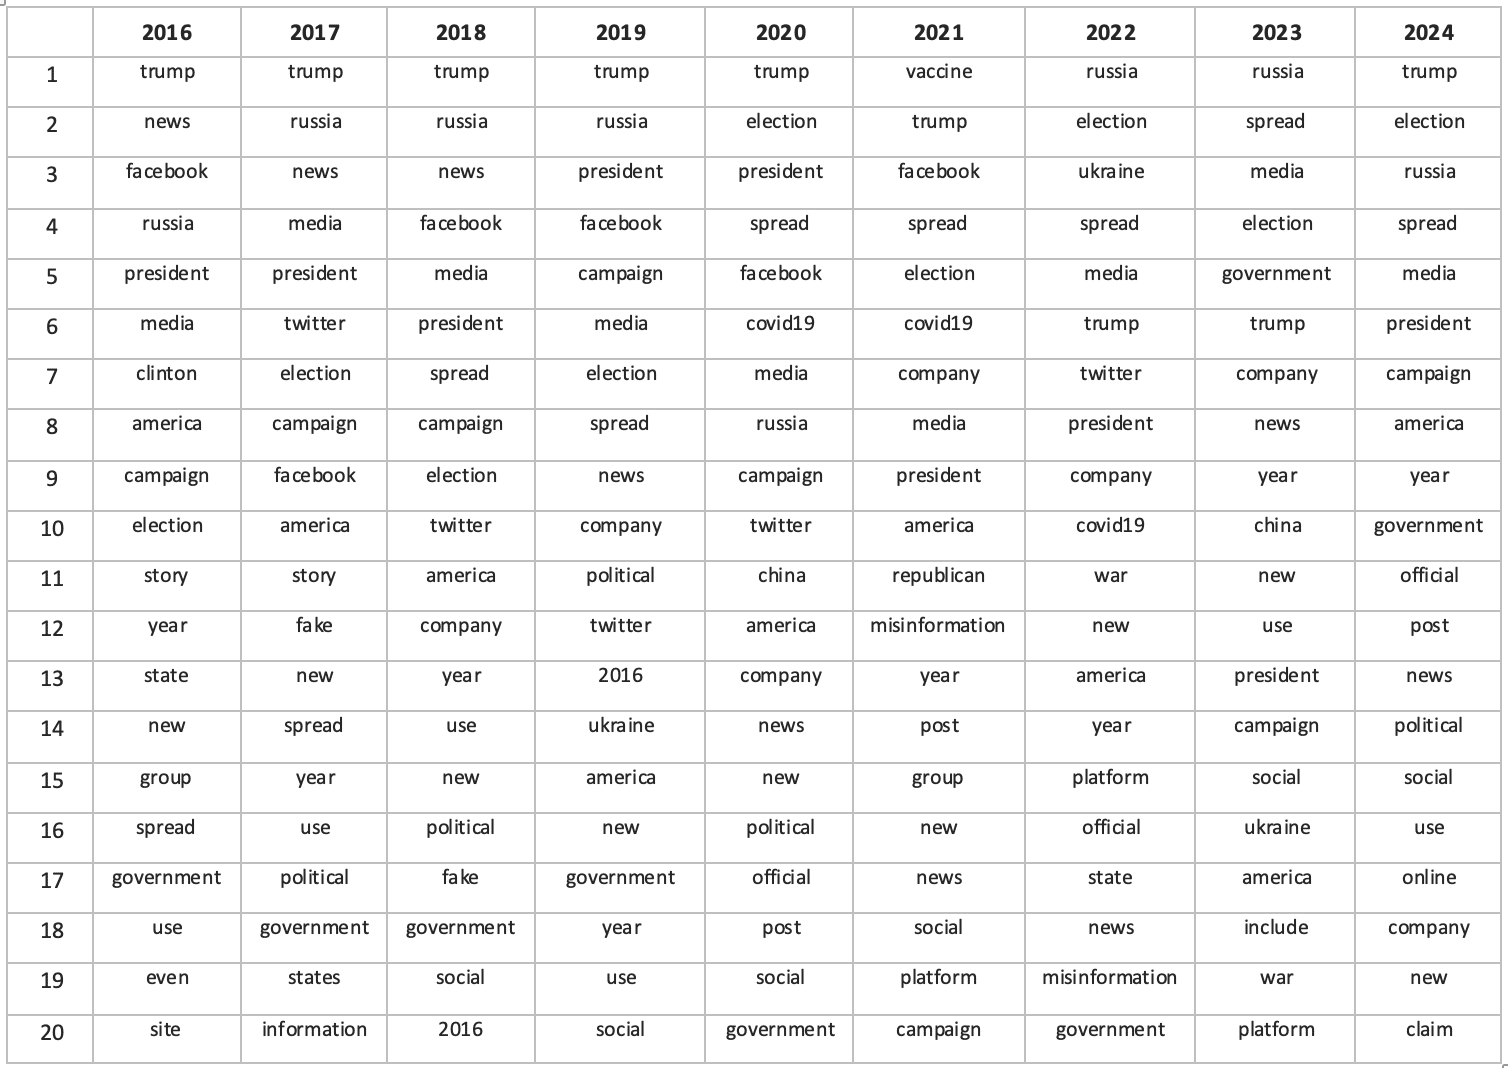
Table 3 shows that for seven out of nine years from 2016 to 2024, Russia was either the first or second word most frequently associated with our misinformation-related terms. Figure 6 focuses just on non-U.S. countries in relation to our search terms. Throughout the period, Russia is a consistent presence, while China and Ukraine appear with more sporadic coverage associated with specific events, that is, for China, COVID-19 in 2020, and for Ukraine, the first Trump impeachment in 2019, and the Russian invasion in 2022.
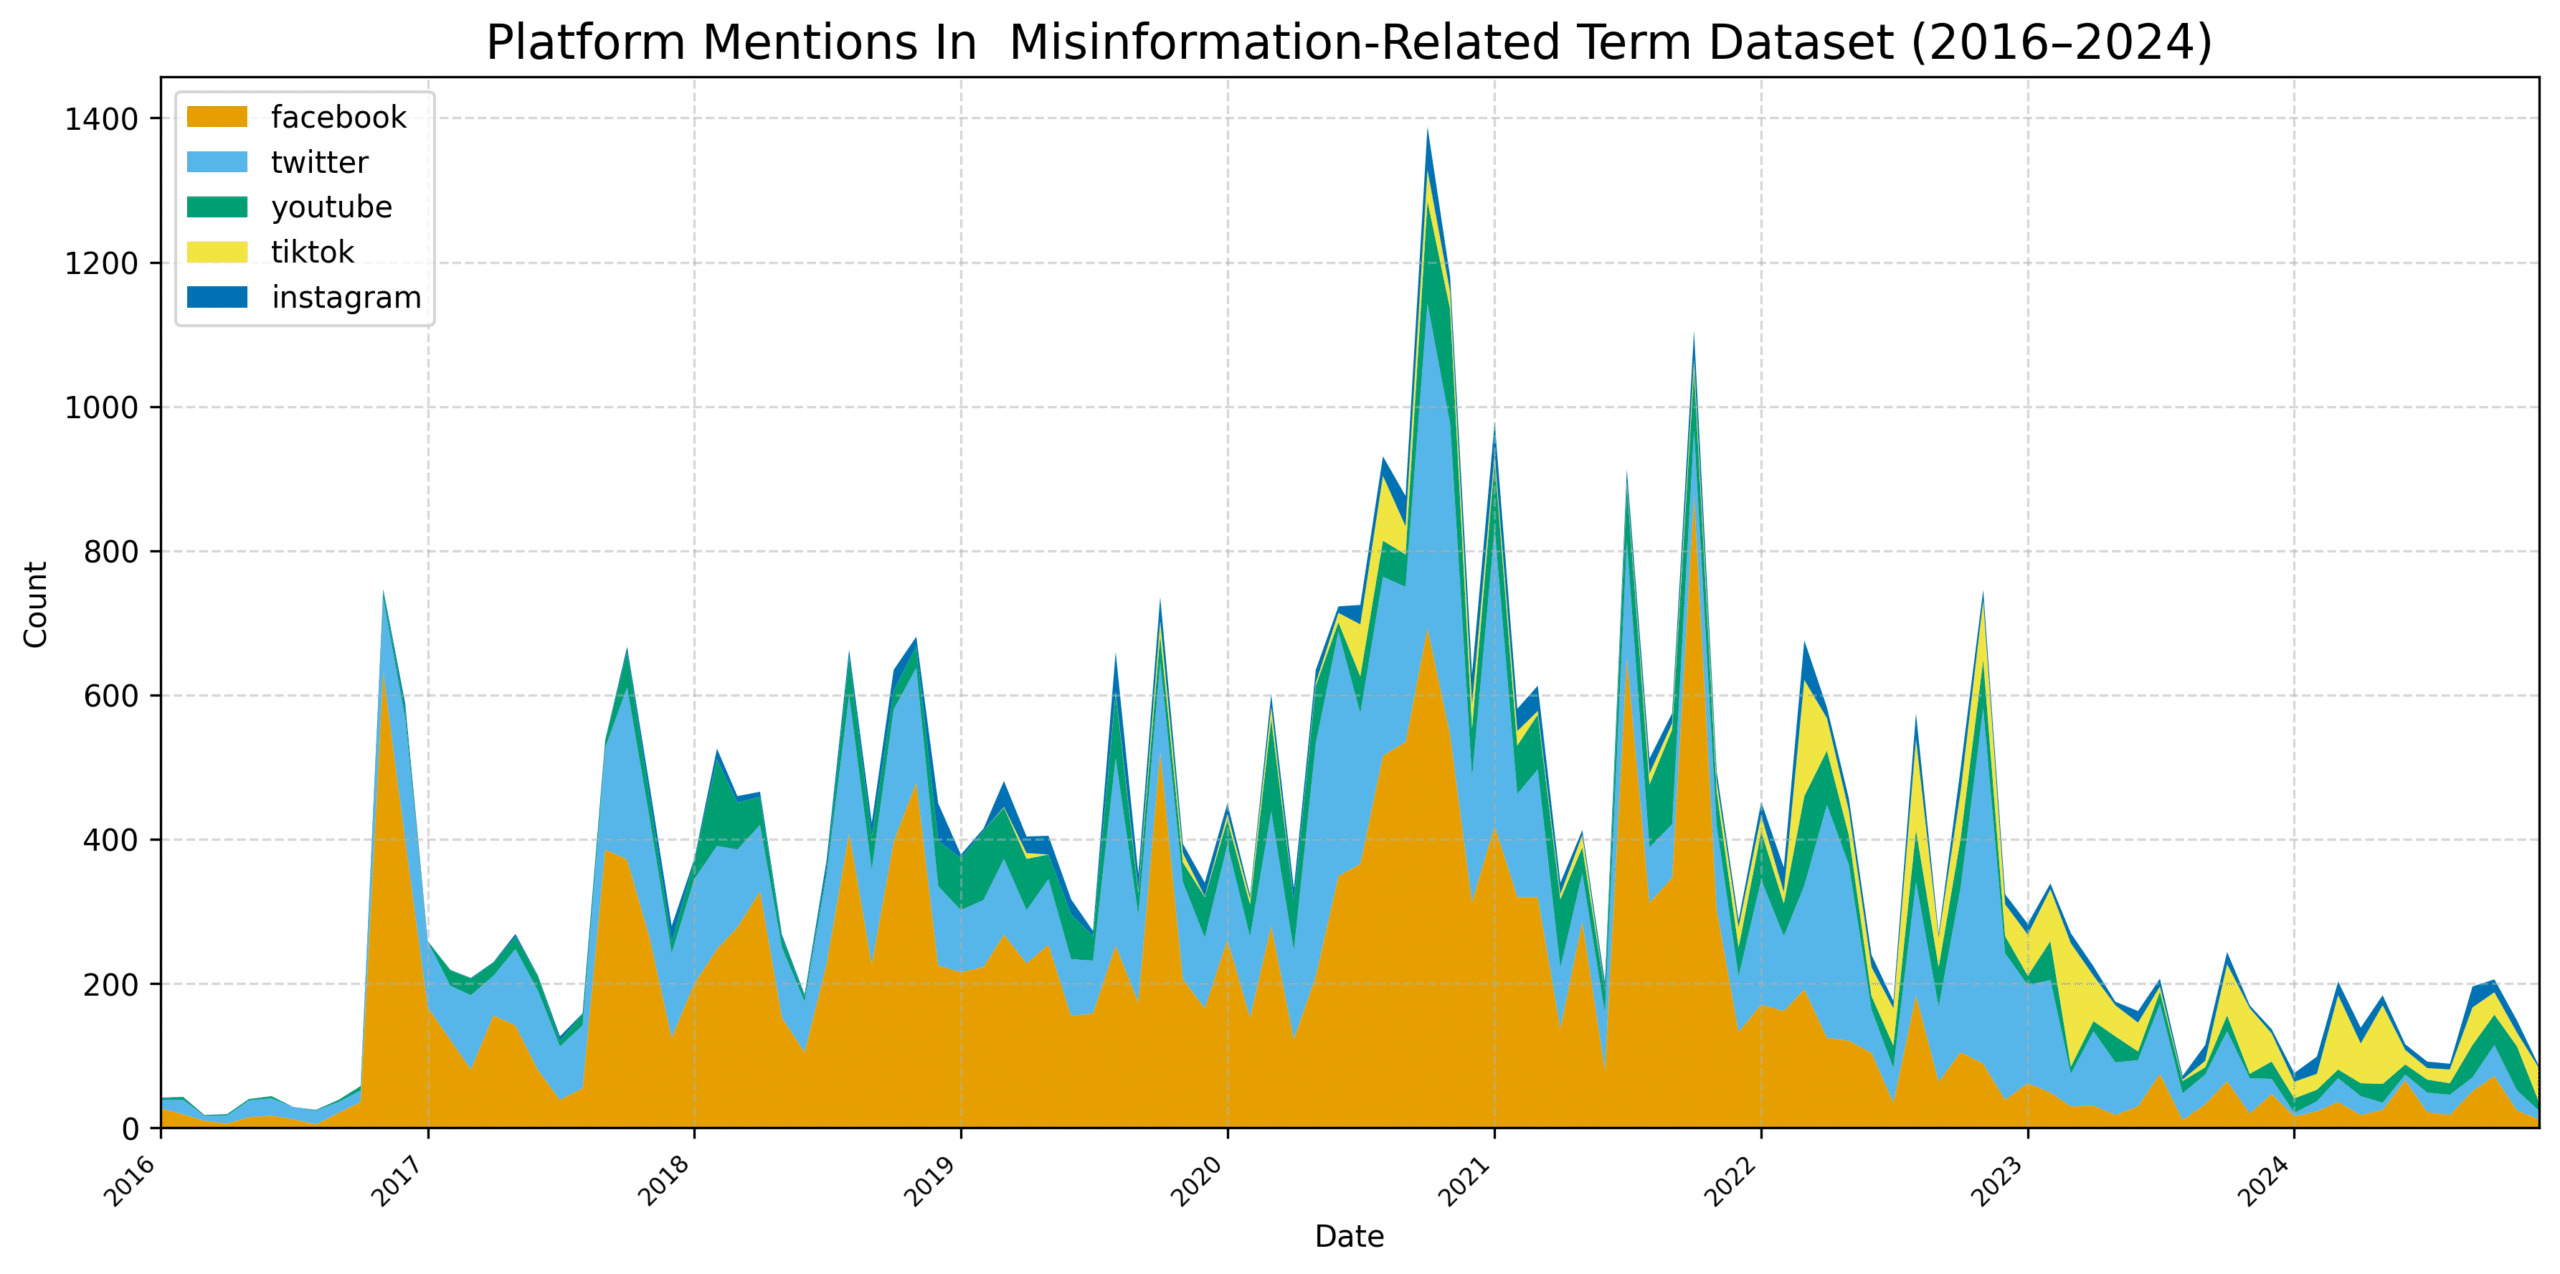
Finding 5: Facebook dominates other social media platforms, followed by Twitter.
The most common social media platform associated with misinformation-related terms was Facebook (mentions of Meta were negligible), followed by Twitter (see Table 4); YouTube and Instagram were mentioned much less. Figure 7 shows that mentions of Facebook peaked in 2021, then sharply declined as TikTok mentions occurred more frequently, with TikTok often becoming the most commonly mentioned platform.
| Rank | Word | # Of Occurrences |
| 1 | 22,808 | |
| 2 | 18,243 | |
| 3 | YouTube | 4,443 |
| 4 | Tiktok | 2,453 |
| 5 | 1,664 | |
| 6 | 1,219 | |
| 7 | Telegram | 858 |
| 8 | 369 | |
| 9 | Snapchat | 100 |
Finding 6: Newspapers had distinct use cases for each misinformation-related term.
In Table 1, we showed that if we look at each search term separately, we see differences in how often the term propaganda was used compared to other terms. We can get a more nuanced sense of how newspapers disambiguate each of these terms by individually investigating their associations.
Disinformation: Associated with elections and the Russian foe
Table 5 shows that Russia was the most frequent term associated with disinformation during 2016–2020. Other top words indicate that this was driven by stories related to allegations of Russian interference in the U.S. election and the first Trump impeachment. Even with the pandemic dominating the discourse of 2020–2021, Russia was still the second most frequently associated word in 2021, moving back to the top position in 2022. During peak usage of disinformation in 2022 (see Figure 2), top words Ukraine and war show that Russia’s invasion of Ukraine became the dominant driver of coverage. We also see disinformation as a term associated with disinformation, meaning that newspapers often used the word repeatedly in close proximity to itself. One other notable pattern is how Facebook was commonly associated with disinformation and vaccine. Twitter was more commonly associated with disinformation and Ukraine.
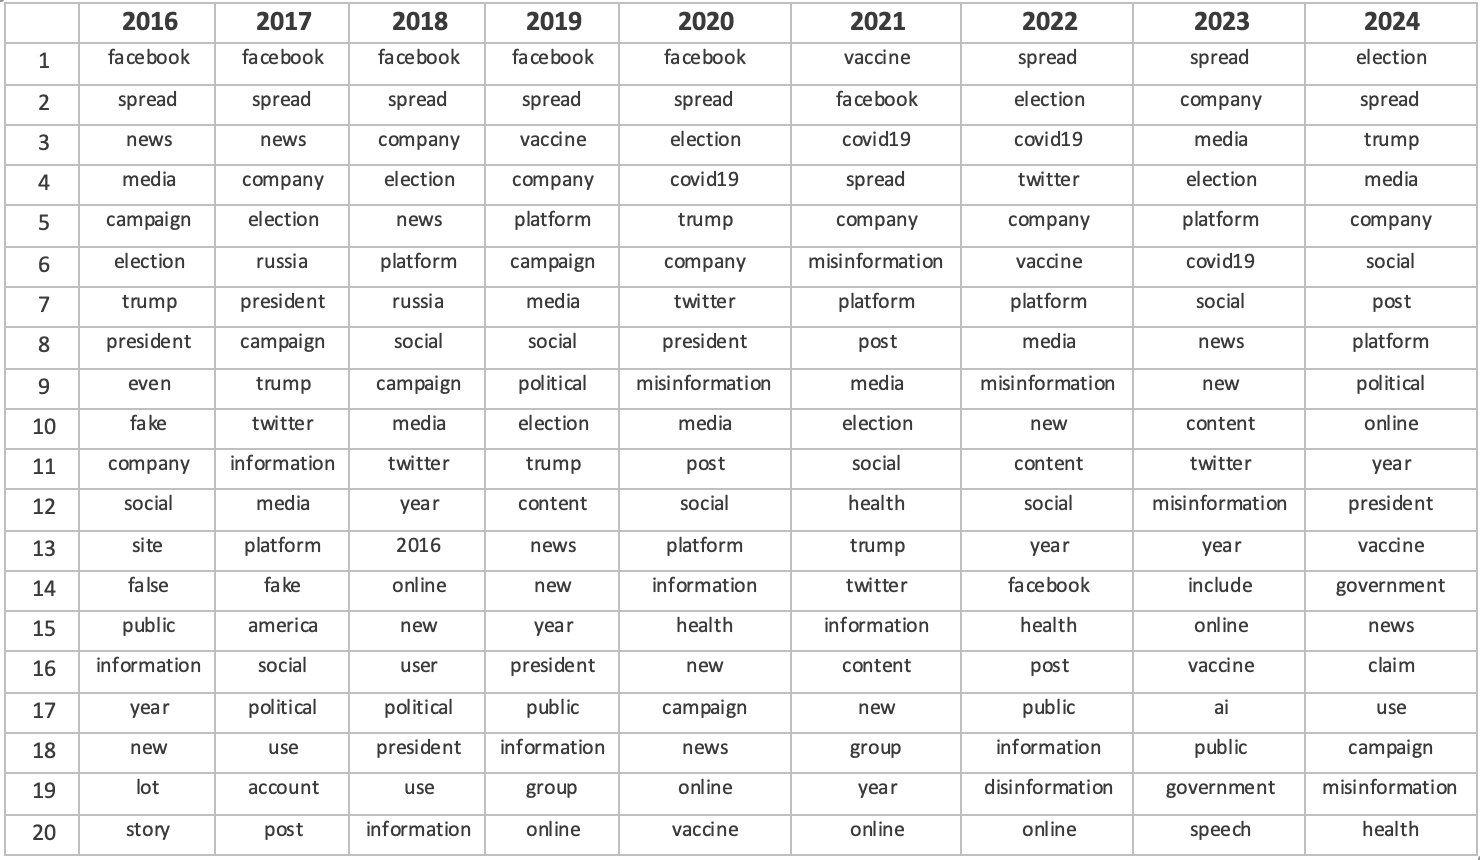
Misinformation: Associated with social media, elections, and public health
Table 6 shows that the most frequent words associated with misinformation are related to concerns about its impact on the public, particularly regarding social media. Compared to disinformation, newspapers used more words related to social media when discussing misinformation. The word Facebook was the most frequently occurring word from 2016 through 2020 and was second in 2021. In 2021 and 2022, terms like vaccine and COVID-19 rose to high positions. Social media terms remained in high positions in 2023 and 2024 but without a specific named platform.
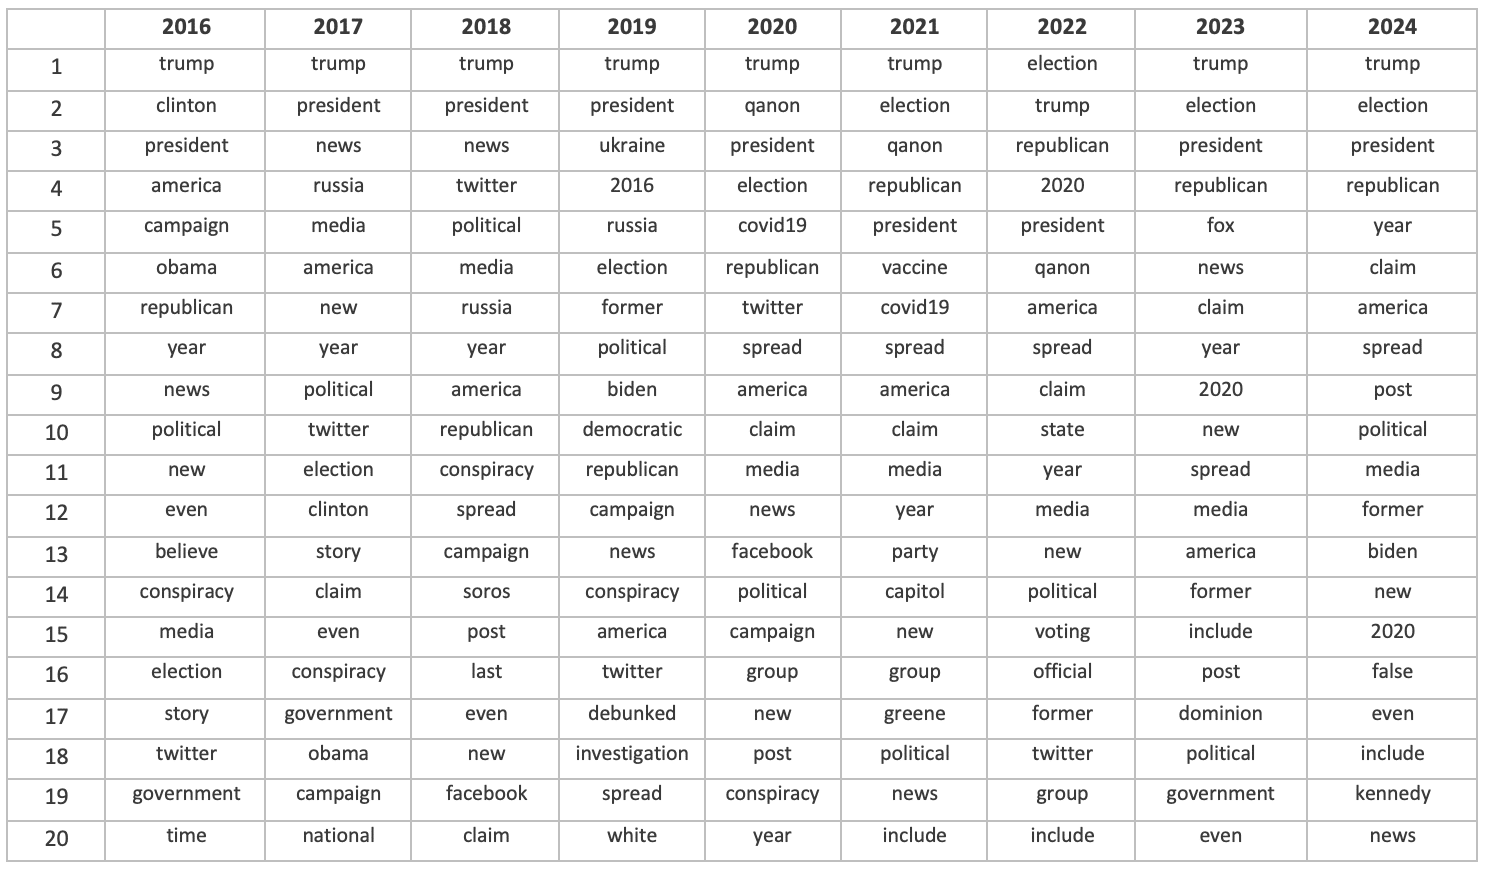
Conspiracy theory: Associated with Trump and right-wing politics
In Table 7, we see that the phrase conspiracy theory was used largely in relation to narratives coming from the right wing of the U.S. political/media spectrum. Most years in this time series include the words Trump, Republican, and Fox (a reference to the Republican-oriented Fox News network). Trump was the most frequently co-occurring word with conspiracy theory from 2016 to 2024, except for 2022. Coverage of Trump’s allegations that the 2020 election was stolen regularly included the phrase conspiracy theory, remaining a focus of coverage through 2024. The QAnon movement and the January 6, 2021, attack on the U.S. Capitol by Trump supporters were also a significant focus of reporting in 2021 and 2022.
Fake news: Associated with Trump and the media
Table 8 shows the shift in use of the phrase fake news from a reference to fraudulent news sites deliberately posting false stories to an attack adopted by President Trump and waged against journalists, news outlets, and political leaders he deemed hostile. The latter interpretation is what drove the explosion in coverage after 2016. Interestingly, in 2022, fake news started to co-occur with misinformation and, in 2023 and 2024, disinformation.
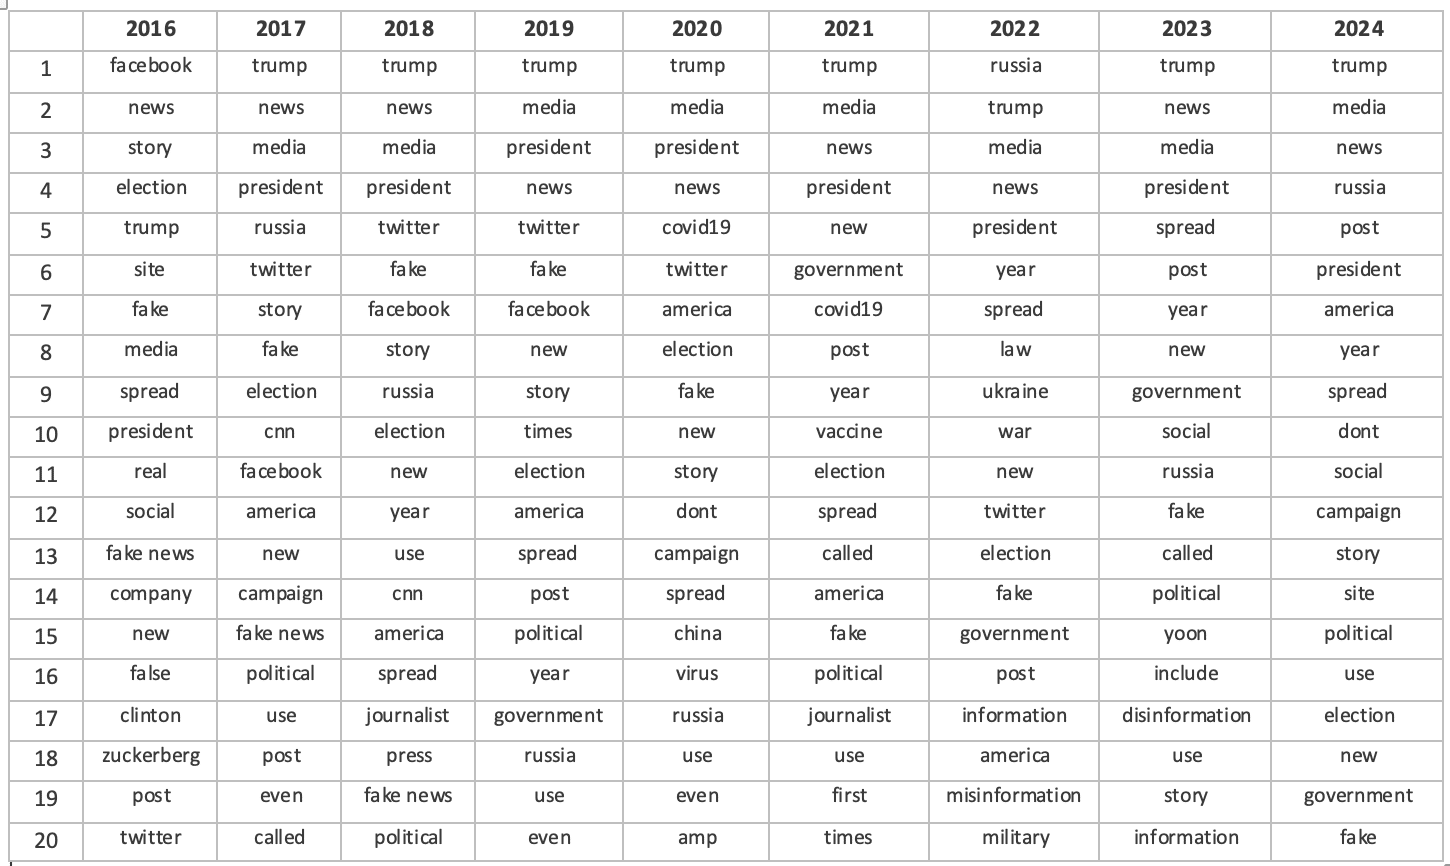
Table 8. The most frequent words for each year associated with fake news, 2016–2024.
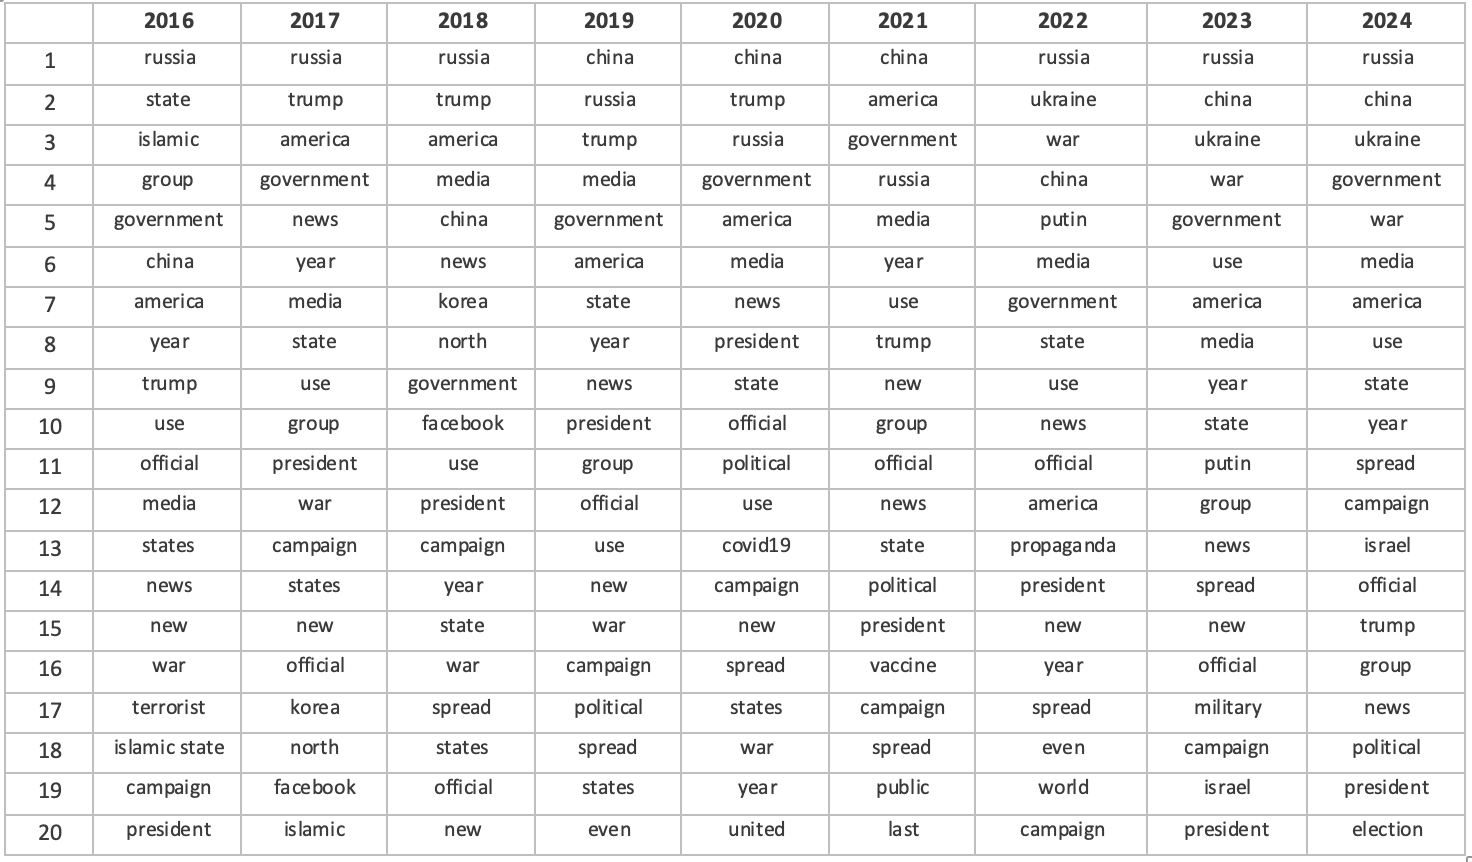
Propaganda: Associated with state actors and the Russia-Ukraine war
Table 9 shows that propaganda was most frequently used in the context of U.S. geopolitical adversaries like the Islamic State, China, or Russia. From 2016–2024, the most frequent term for six out of the nine years was Russia. The Islamic state was the dominant focus in 2016, and the pandemic in 2020 and 2021 saw China rise to the most frequently co-occurring term. In 2022, the Russian invasion of Ukraine brought Russia back to the top.
Methods
We used ProQuest TDM Studio to access the ProQuest U.S. Major Dailies dataset, which includes historical archives of The Chicago Tribune, Los Angeles Times, New York Times, Wall Street Journal, and Washington Post. We searched all articles that used the phrases misinformation, disinformation, propaganda, conspiracy theory, conspiracy theories, and fake news from January 1, 1987, to December 31, 2024.
The data received from ProQuest came in the form of XML files for each of the 196,989 articles that met the criteria. To accurately parse the data, we removed any markup tags to ensure that only the readable text was captured. To clean the dataset and correct for any issues from text identification during scanning, we removed all non-alphanumeric and non-ASCII characters other than hyphens and ending punctuations; question marks and periods were replaced with spaces. Since hyphens are often attached to the keywords listed above, we removed hyphens that preceded or trailed a given keyword.
We then extracted every use of each of these search terms throughout all of the articles from each dataset. We included the 25 words that preceded and followed each instance of each search term to capture its context. Within a single article, multiple occurrences of each search term were counted separately. We then removed any duplicate title/context combinations. The results of this process are displayed in Table 10.
| Term | # of Occurrences |
| disinformation | 40,556 |
| misinformation | 58,116 |
| fake news | 29,409 |
| propaganda | 106,486 |
| conspiracy theory/ conspiracy theories | 57,699 |
In order to answer our research questions, we analyzed the dataset for word frequencies during certain periods. We removed all multi-letter stopwords (e.g., “the,” “and,” “of”) using the Natural Language Toolkit package, augmented with our own list of stopwords developed during data exploration. We further cleaned the text using a set of stem mappings developed during exploration (i.e., turning ukrainian to ukraine, trumps to trump, or coronavirus to covid19). We also included a custom list of n-grams based on data exploration to better capture core concepts (i.e., fake news, white house, u k, or u s s r). We then removed any remaining single-letter words that were not a part of an n-gram. All data cleaning choices can be seen in our code in the Data Availability section.