
[ad_1]
In a recent interview, President Donald Trump falsely claimed to be the “lowest of the last 10 presidents on inflation,” seemingly based on a chart Trump posted to social media that misleadingly compares price growth over the first 18 months of his second term with total inflation at the end of his predecessors’ full four-year terms.
For that comparison to hold, of course, you have to assume inflation will be 0% for the next two and a half years — a highly implausible scenario.
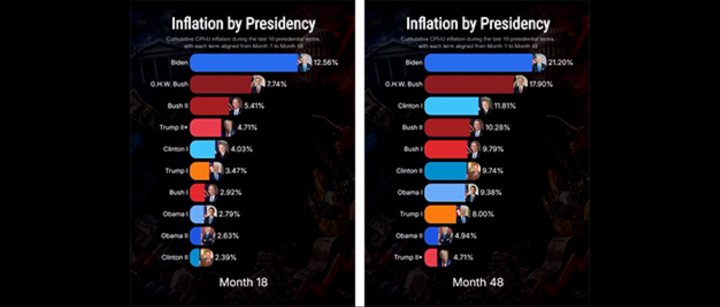
A more telling comparison is to look at where inflation stood 18 months into each of the last 10 presidential terms. By that metric, Trump doesn’t have the lowest inflation at this point in his term, but rather the fourth highest.
Trump posted the video infographic — which appears to come from an Instagram creator of “viral money charts” — on his Truth Social account Aug. 9. Titled “Inflation by Presidency” and scored to dramatic music, it purports to show cumulative inflation for each of the last 10 presidential terms (not presidents) at months one through 48. The rankings change each month as total inflation grows.
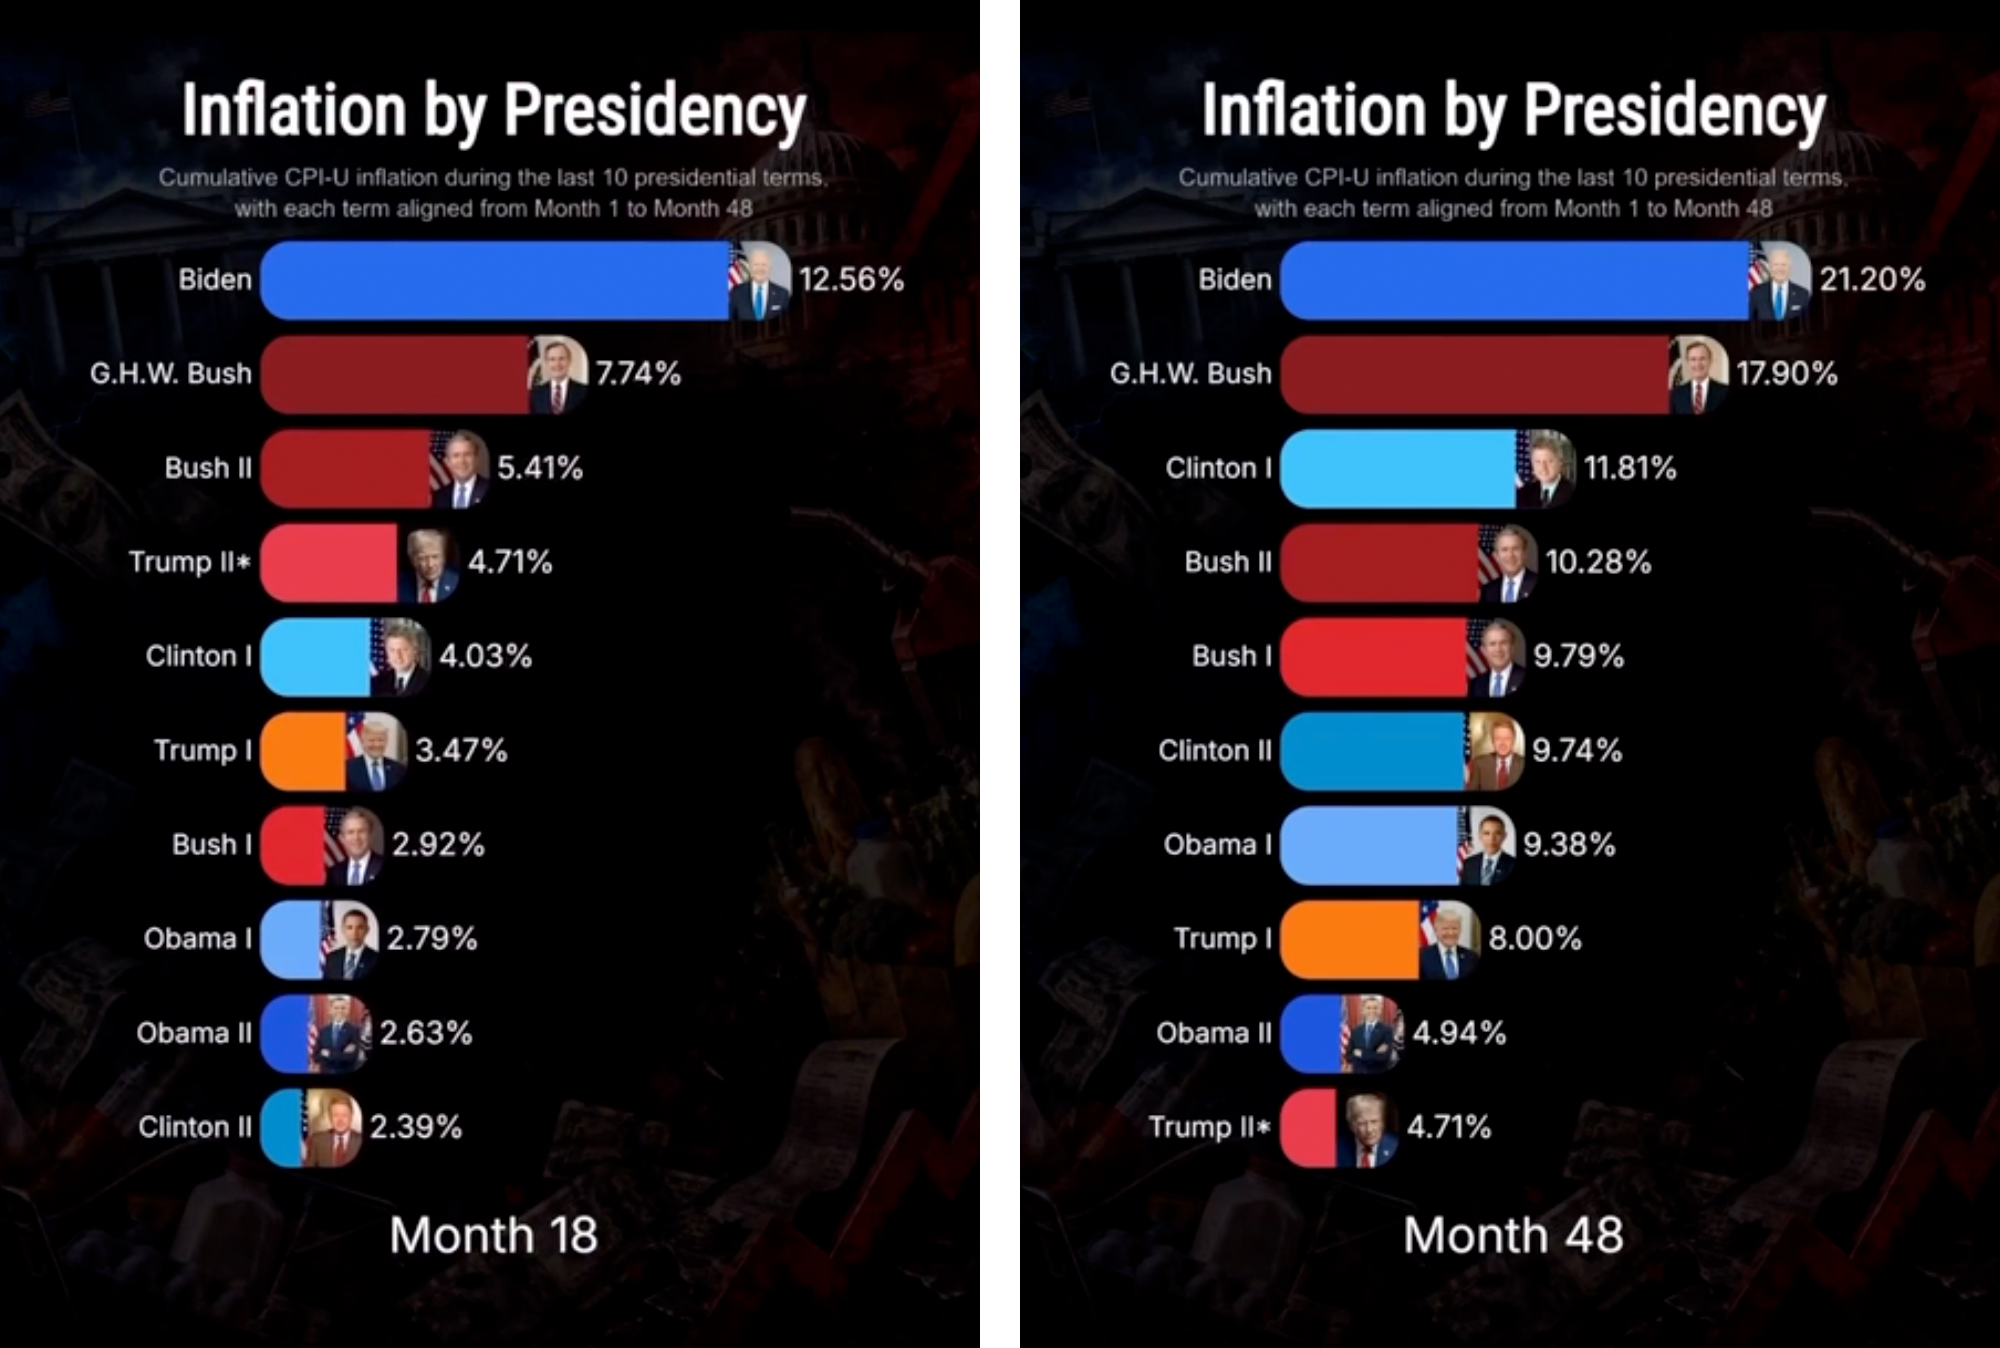
After 18 months, however, the “Trump II” inflation total stops growing — because the rest of his presidency hasn’t happened yet — while the others continue to climb. As a result, Trump’s second term drops through the rankings and is shown as having the lowest cumulative inflation after 48 months.
Trump bragged about this deceptive statistic in an interview with conservative commentator Wayne Allyn Root, which was posted online Aug. 11.
“Did you see the charts that came in yesterday?” Trump said. “I’m the lowest of the last 10 presidents on inflation. I mean, it’s crazy. It’s a chart.”
In fact, federal economic data show cumulative inflation at this point in Trump’s second term is higher than it was at the same point in most of his recent predecessors’ terms.
According to the Bureau of Labor Statistics’ Consumer Price Index, prices grew 4.34% between January 2025 and July 2026. Going back to the late 1980s, only three presidents presided over higher inflation in their first 18 months — Joe Biden with 12.27%, George H.W. Bush with 7.67% and second-term George W. Bush with 5.90%.
The rest — both Clinton and Obama terms, George W. Bush’s first term and Trump’s first term — were all between 2.38% (Clinton’s second term) and 3.92% (Clinton’s first term) a year and a half after inauguration.
The creator of the graphic, an Instragram creator with the handle @yunggeeski_, told us in a message that their aim was to show the “full trajectories” of previous administrations, and the software they use would have made it hard to remove Trump’s second term from the data after month 18.
“The chart itself wasn’t intended to claim that Trump will have the lowest inflation over an entire term, since obviously the remainder of the term hasn’t happened yet,” they said.
Asked for comment, White House spokesman Kush Desai did not directly address the president’s use of the misleading statistic, but touted what he said were the administration’s successes in fighting inflation.
“President Trump inherited the worst inflation crisis in a generation, and has implemented policies that have brought prices of key essentials ranging from prescription drugs to eggs to auto insurance down in historic ways, with even more relief to come,” Desai said in a statement. (While prices of those three items have indeed come down in the past year, the overall inflation rate is higher than when Trump took office.)
“Given the President cannot definitely predict inflation rates in the future, only an idiot would take issue with him touting the results of his agenda so far,” Desai added.
But “so far” Trump isn’t the “lowest of the last 10 presidents on inflation,” as he claimed.
Editor’s note: FactCheck.org does not accept advertising. We rely on grants and individual donations from people like you. Please consider a donation. Credit card donations may be made through our “Donate” page. If you prefer to give by check, send to: FactCheck.org, Annenberg Public Policy Center, P.O. Box 58100, Philadelphia, PA 19102.
[ad_2]
Source link
